How to Use Table Charts for Dashboard Widgets

Table charts can be used to display large amounts of data in an easy to understand format. They can also be used to compare two or more data sets side by side. Table charts are especially useful for displaying large amounts of data in a dashboard widget, as they provide a clear overview of the data.

Step 1: Add a widget

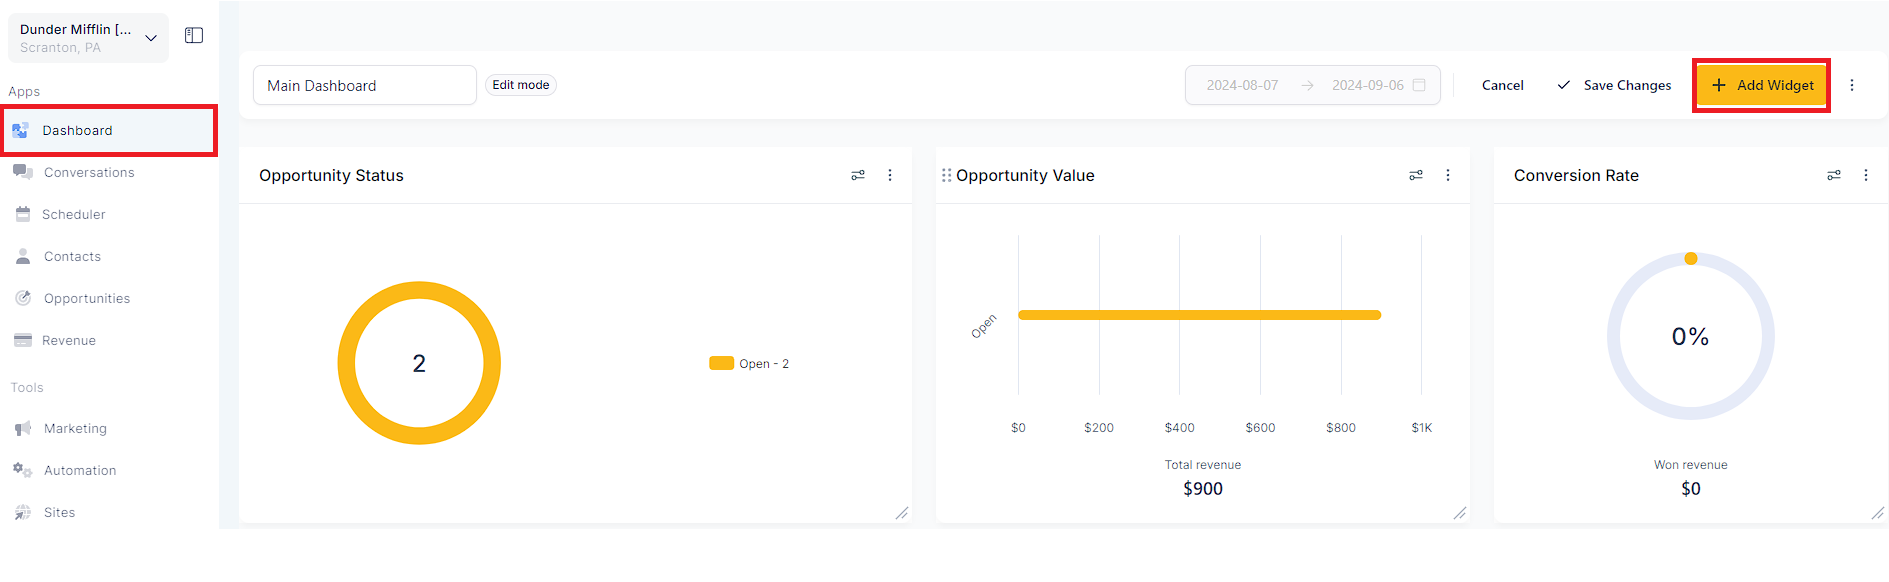
  • On your dashboard, click "Edit" and then "Add Widgets".

Step 2: Choose Table chart

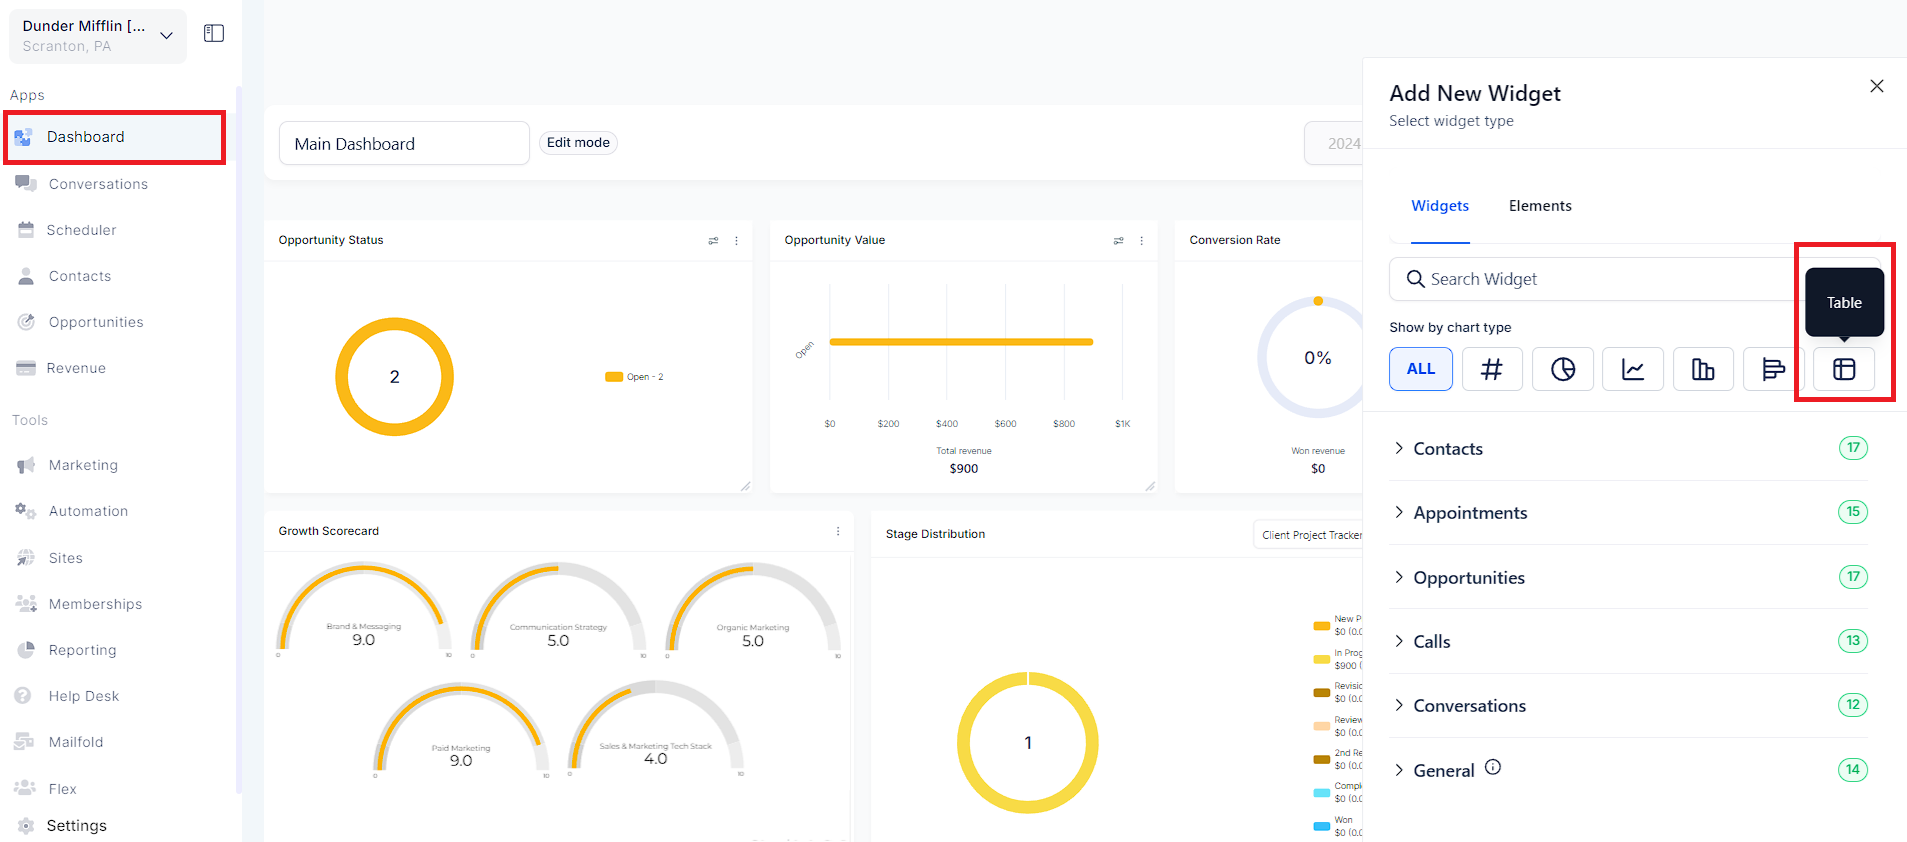
  • Scroll down to the widget you want to add and change the chart type to table.

Step 3: Configure your widget

  • To manage columns on your widget, click Select "Columns".

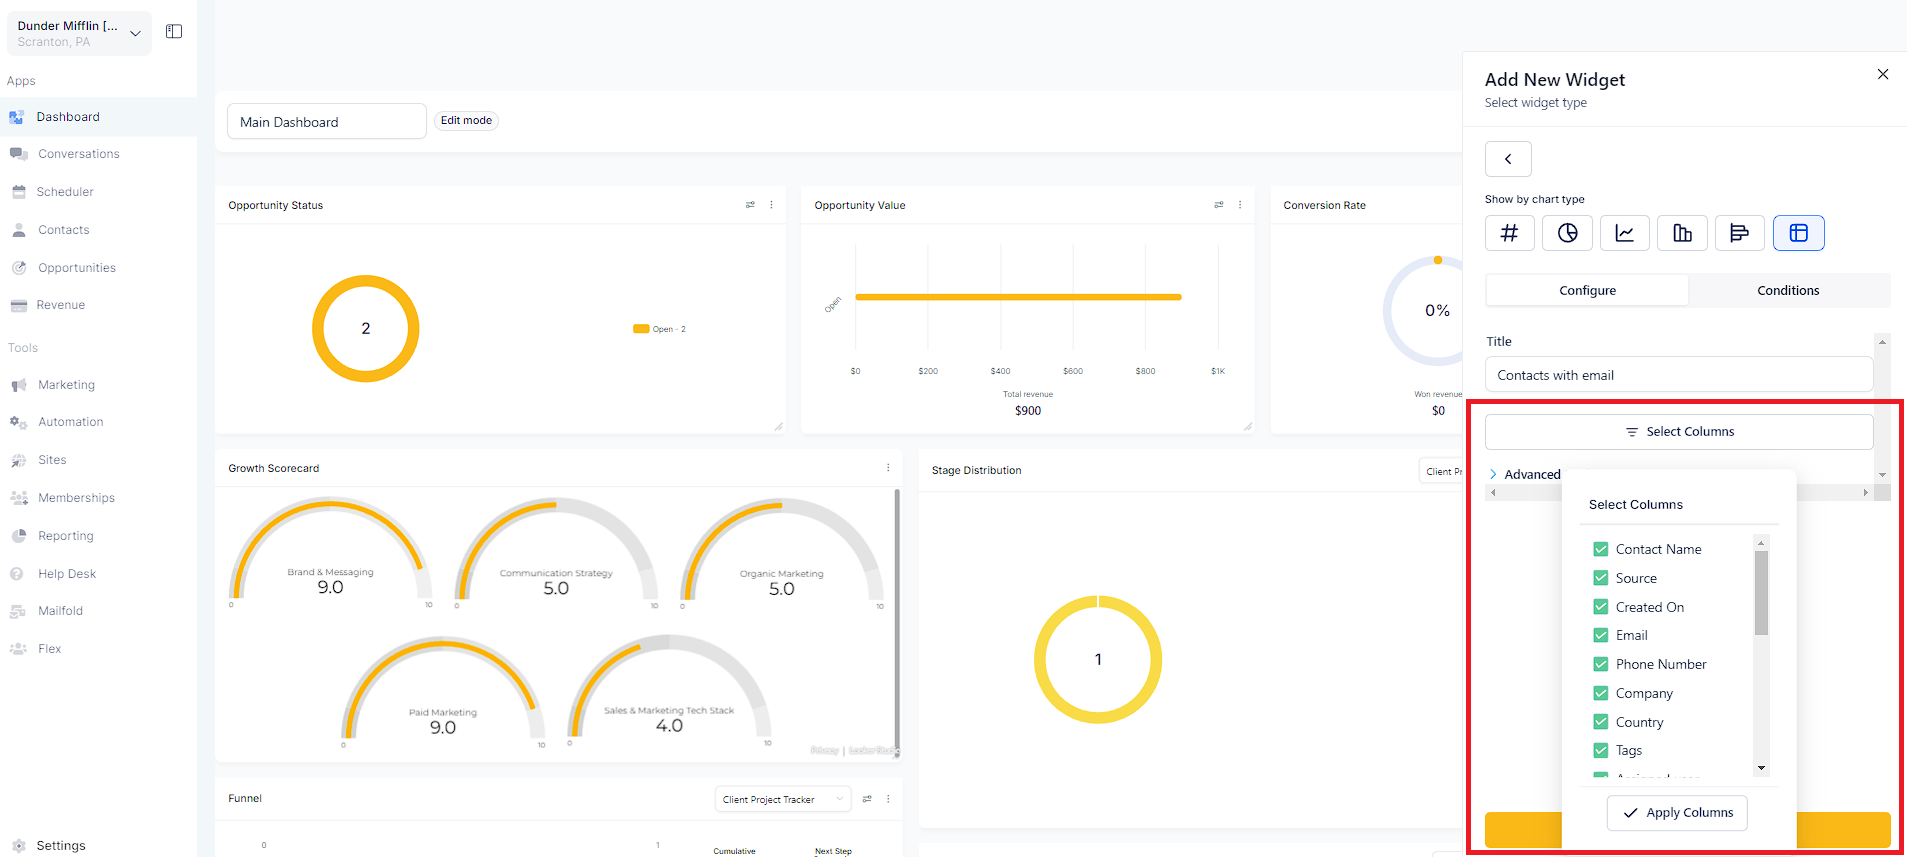
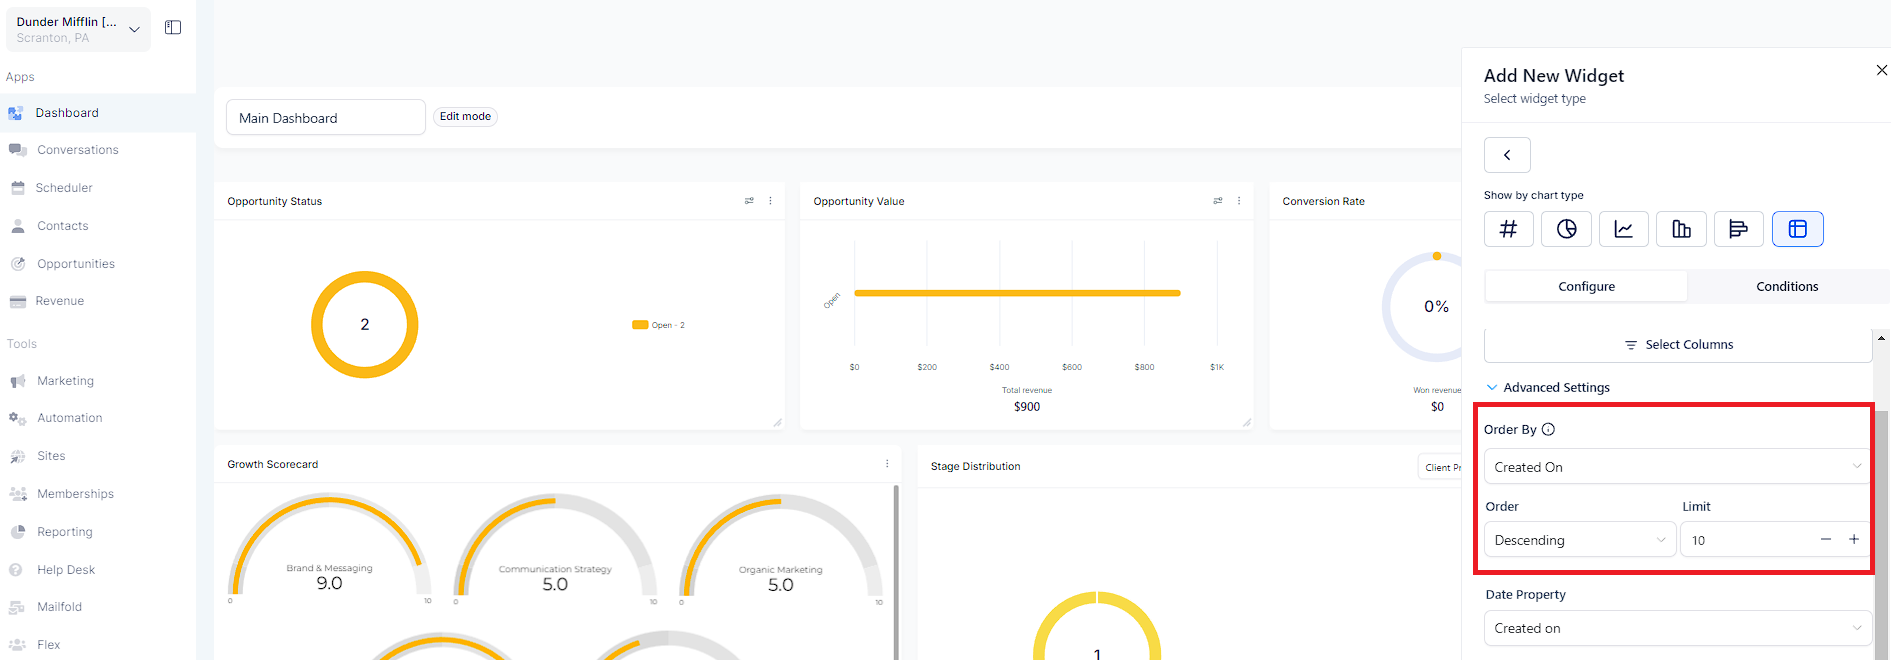
In "Advance Settings", you can choose the column on which you want to order the table.

Step 3: Save your changes

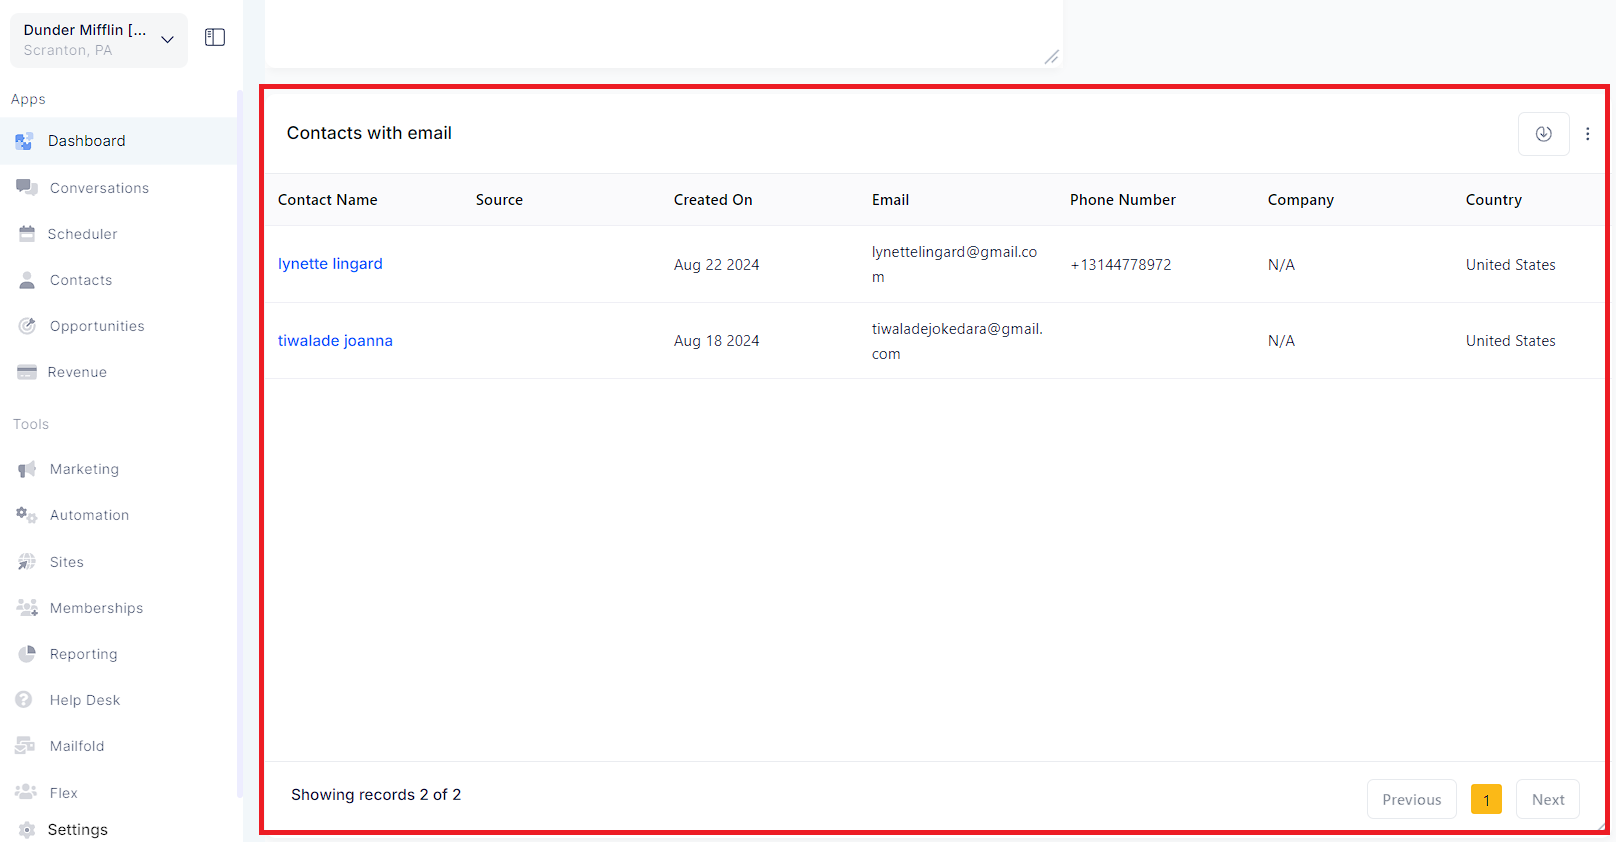
  • Click on "Save" to add your widget on the Dashboard.

Did this answer your question?
😞
😐
😁