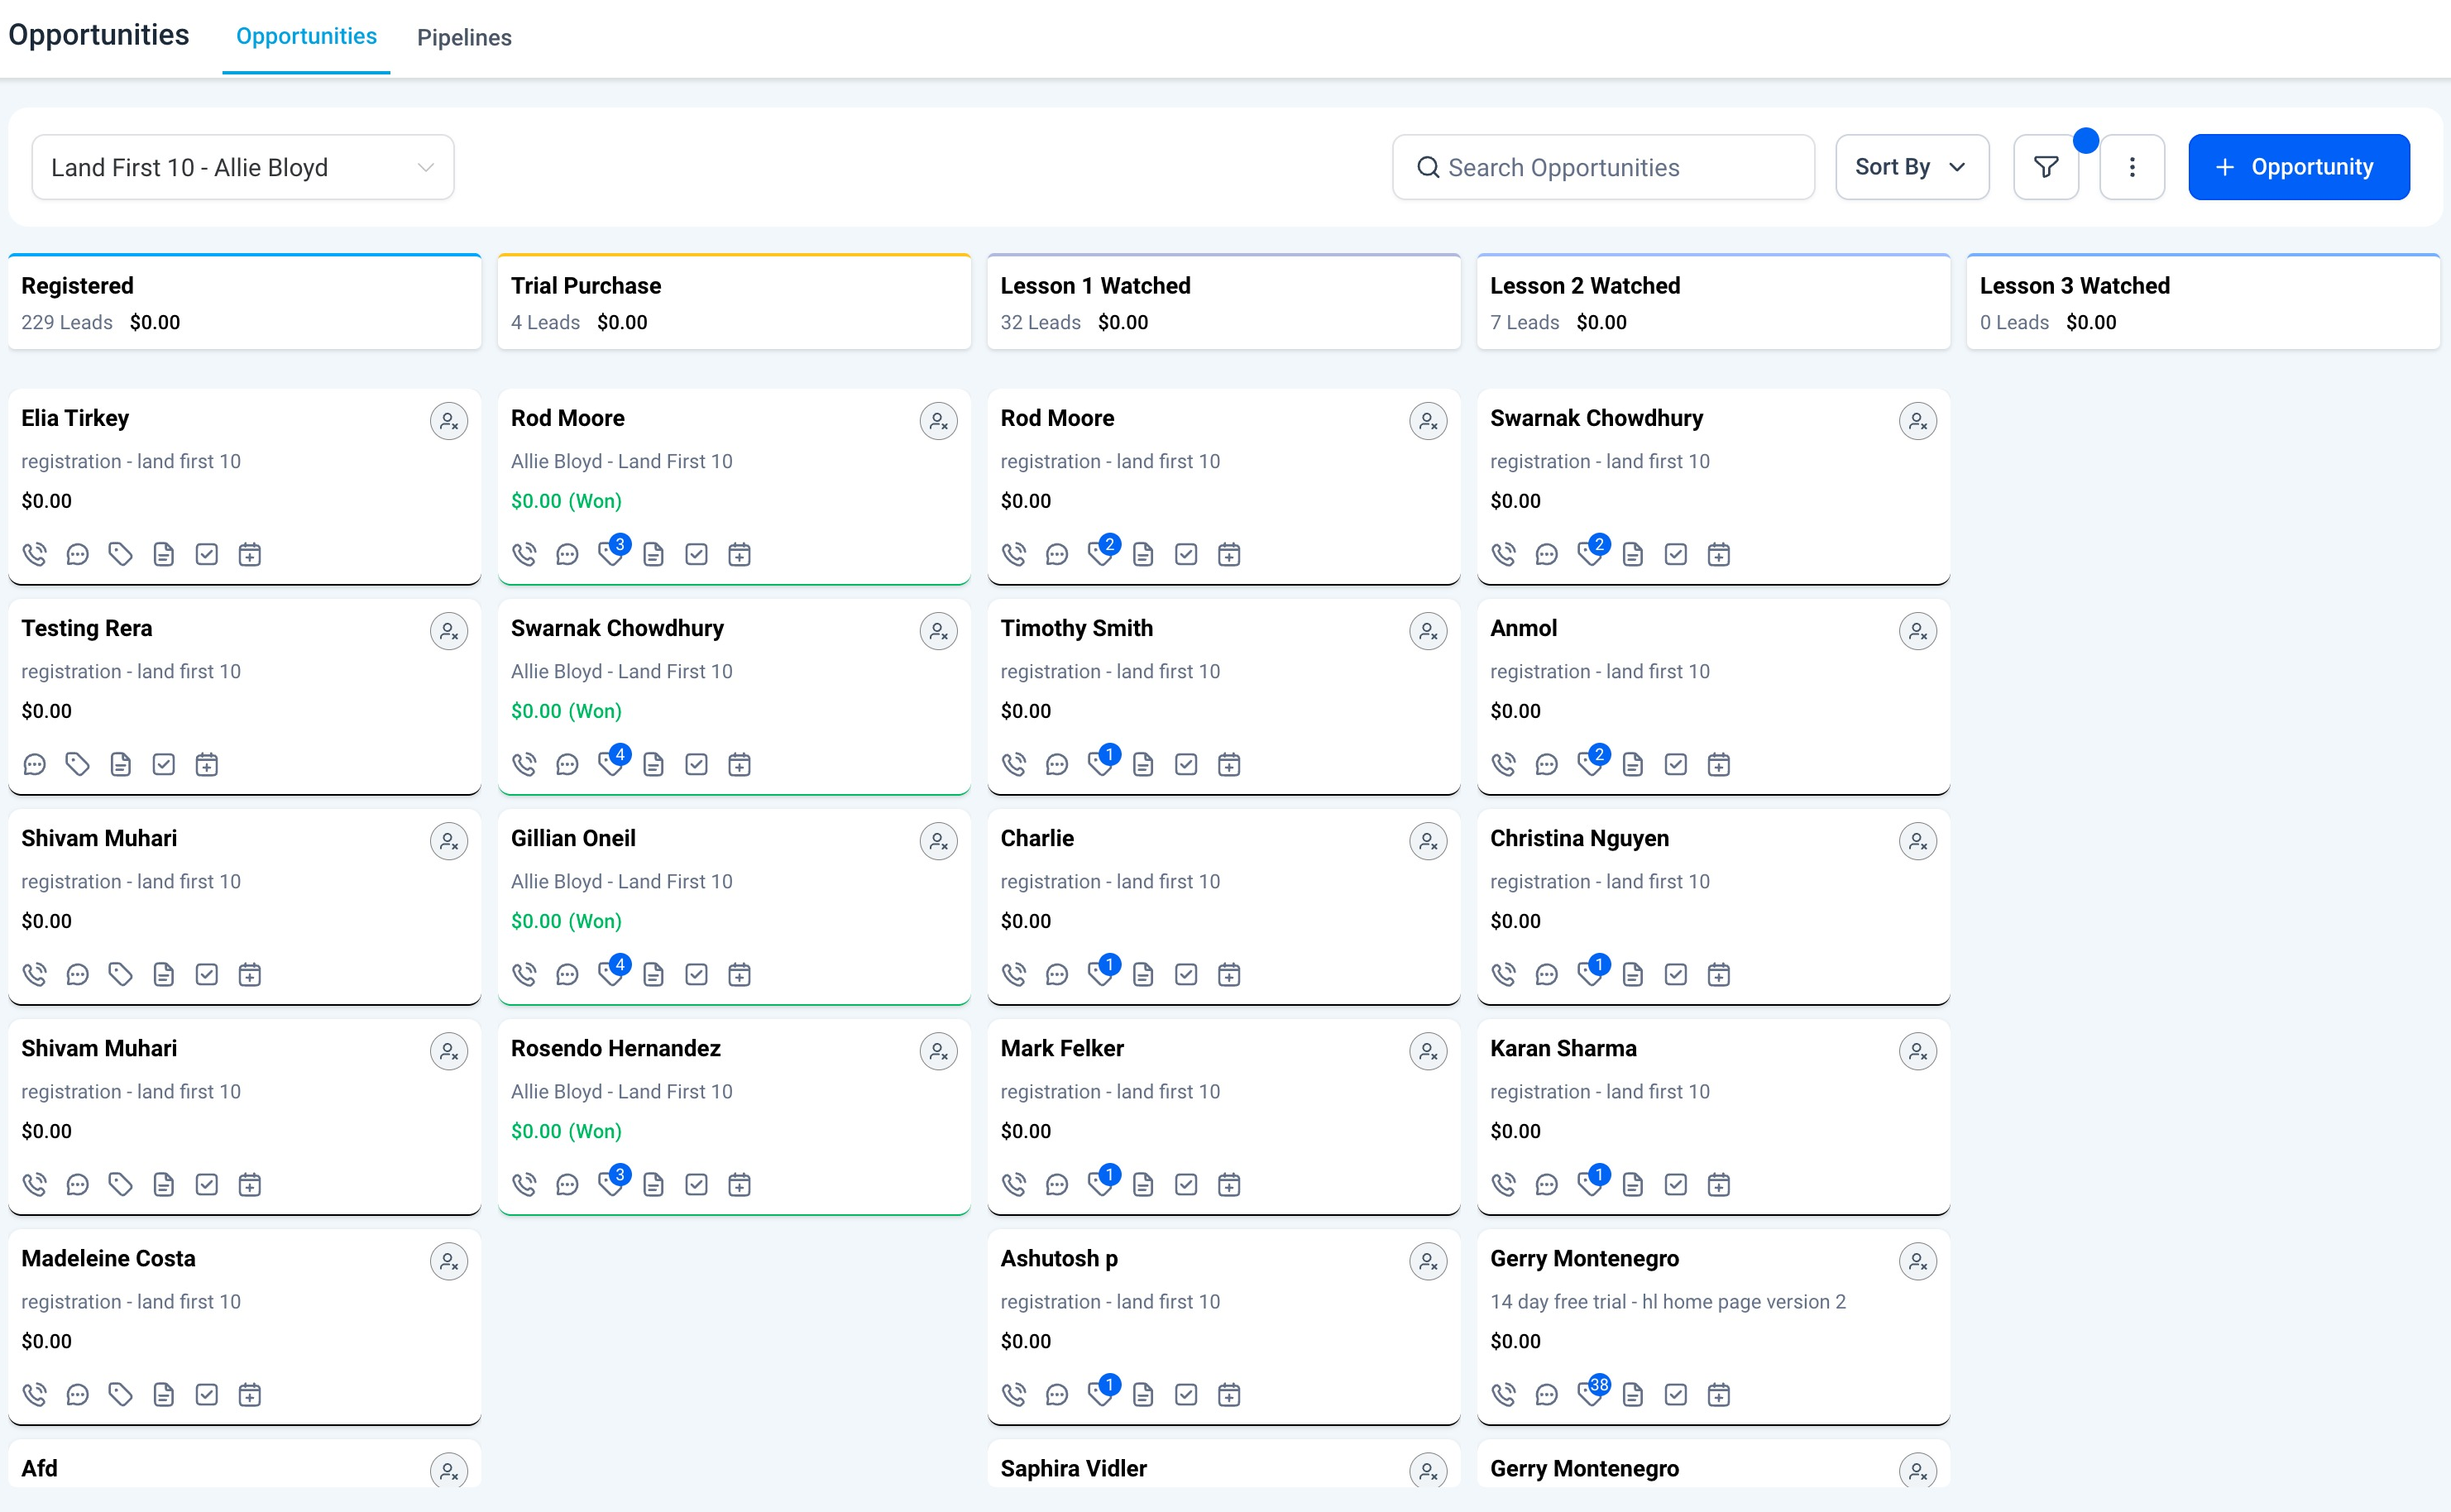
This widget illustrates how data gradually moves from one stage to another via a step-by-step process. In a conversion or sales funnel, this visualization is often used to track the progress of leads or opportunities.
With the dropdown menu within the widget, you can easily switch between funnels.
Please Note:
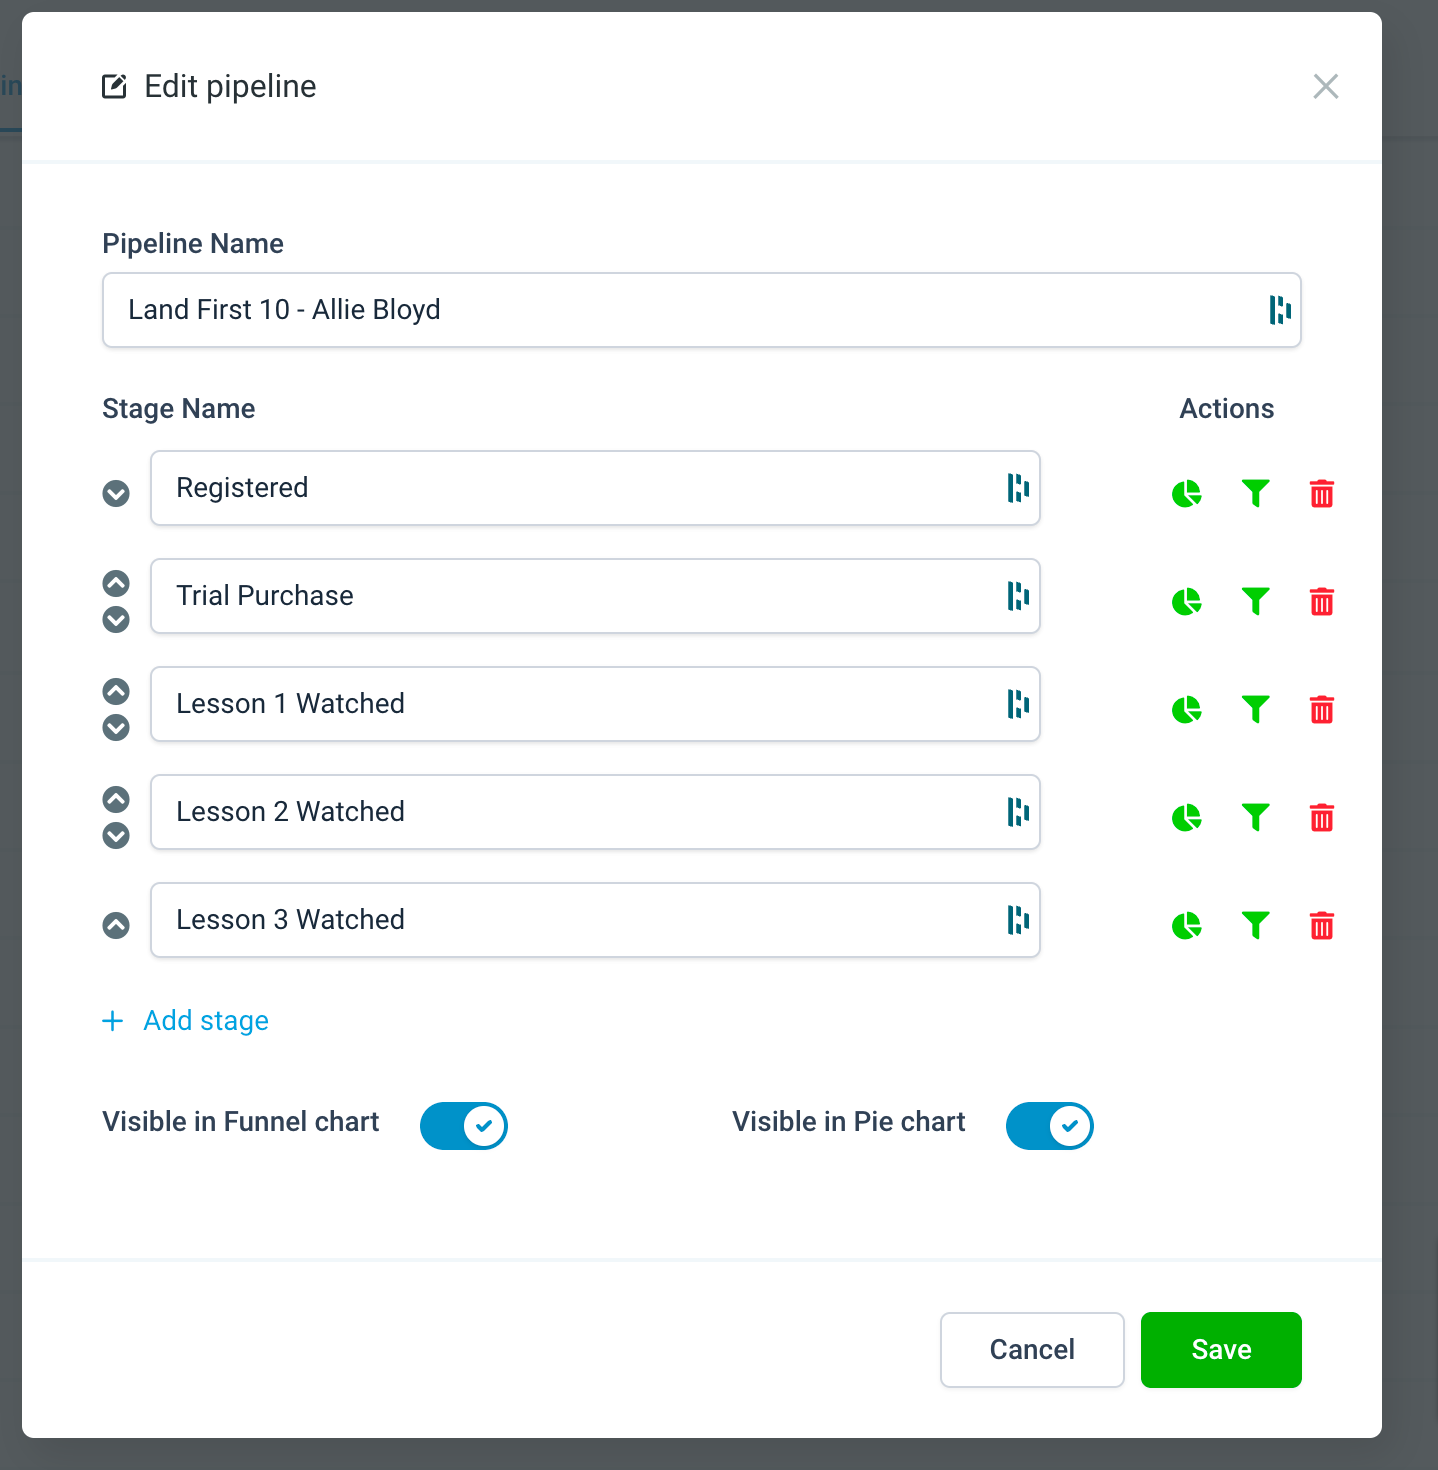
To access this widget, you need Dashboard stats permission enabled. Additionally, for a pipeline to be visible in the Funnel Chart, you must enable the 'Visible in the Funnel Chart' toggle within Pipeline Settings.
The opportunities last_status_change_date is considered while calculating the count in each stage on the chart instead of the "Created" date.
The funnel widget shows sequential data of the current and the next stages in each section.
For example, Let's assume we have a pipeline with the following stages and data.