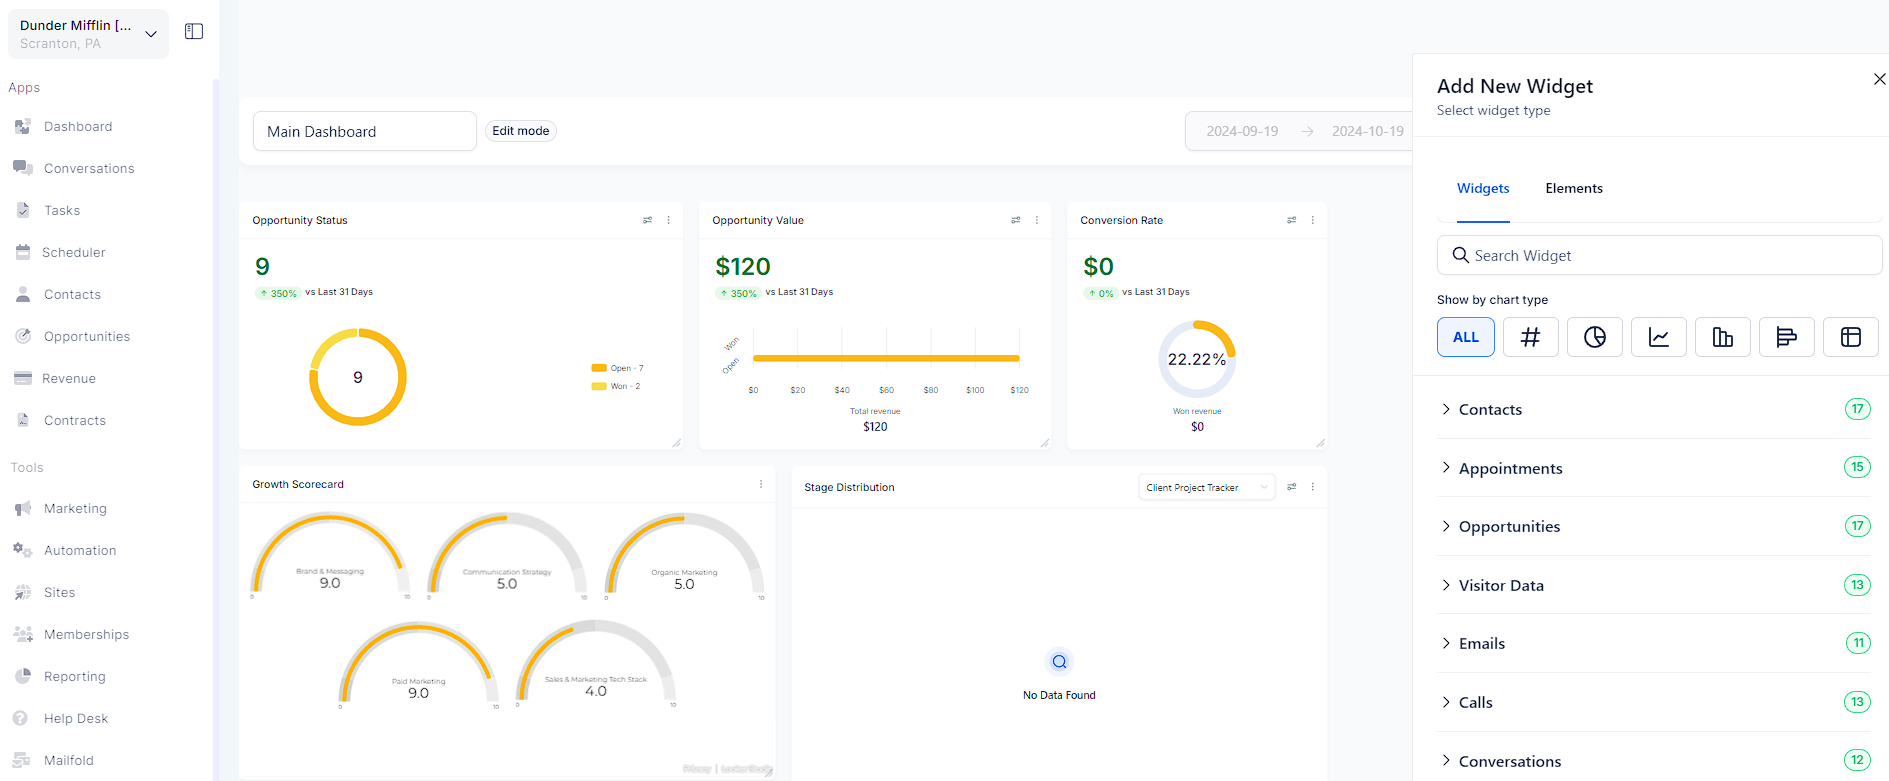
Start by choosing a widget from the widget list.
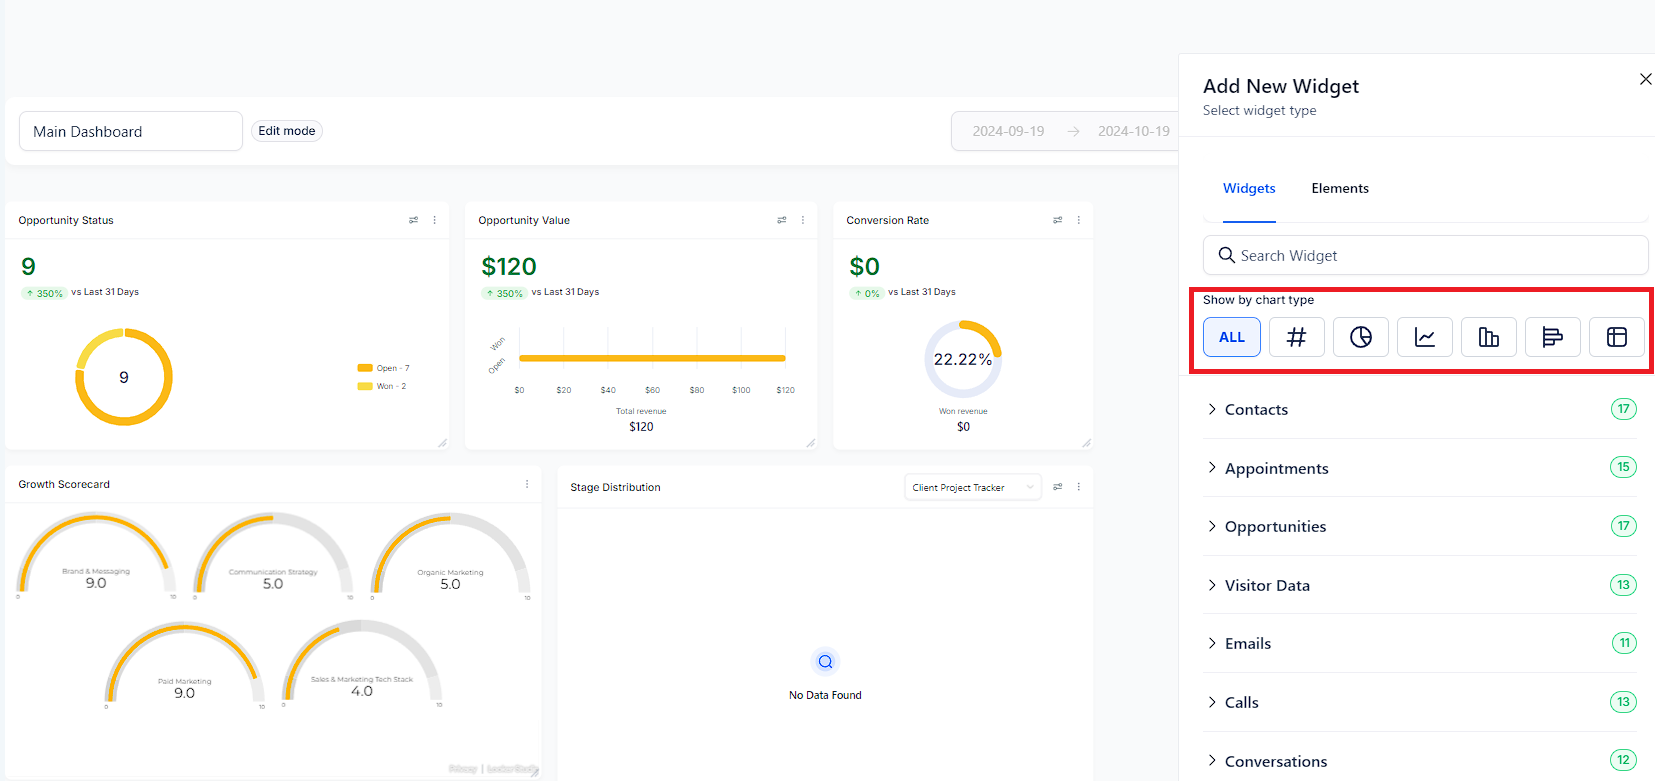
Under the "ALL" filter, the default chart type is automatically selected for each widget.
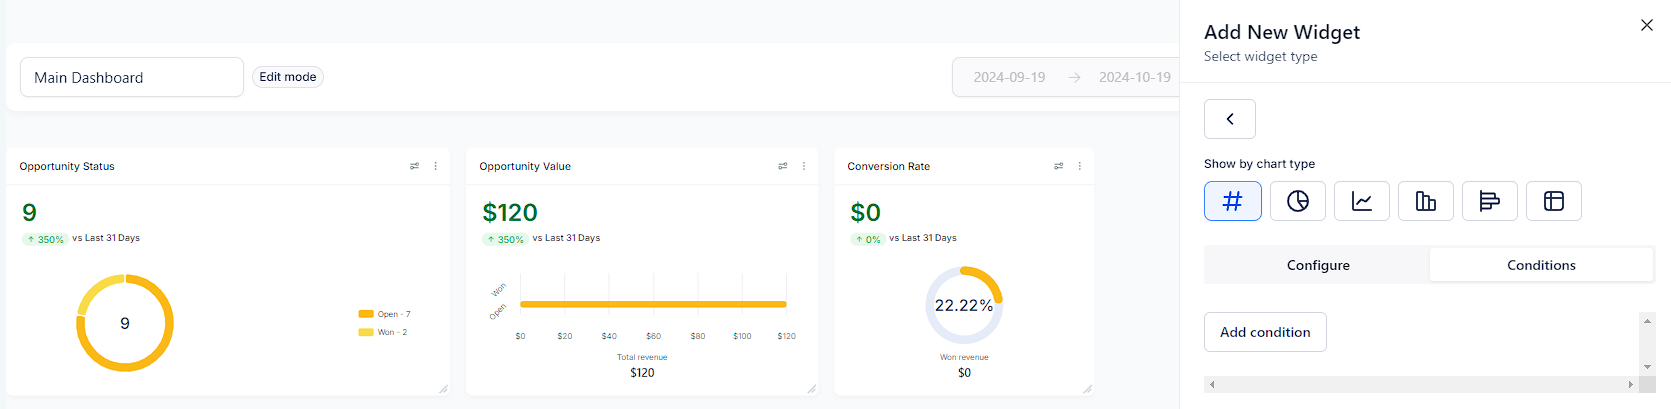
You can change the chart type by clicking on the chart icon.
Head to the "Configure" tab to further customize the widget:
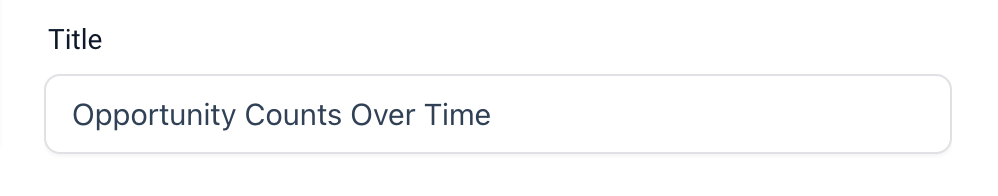
Title : Change the widget's title according to your conditions. A clear title makes it easier for you and your team to understand.
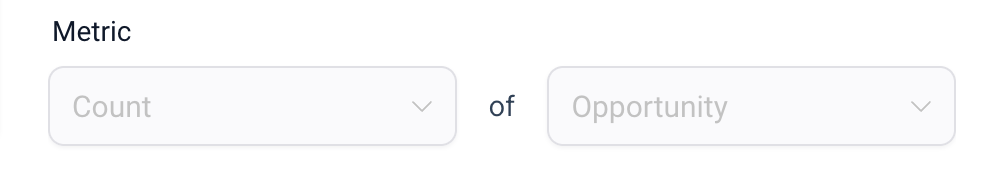
Metrics : Switch data points for your widget
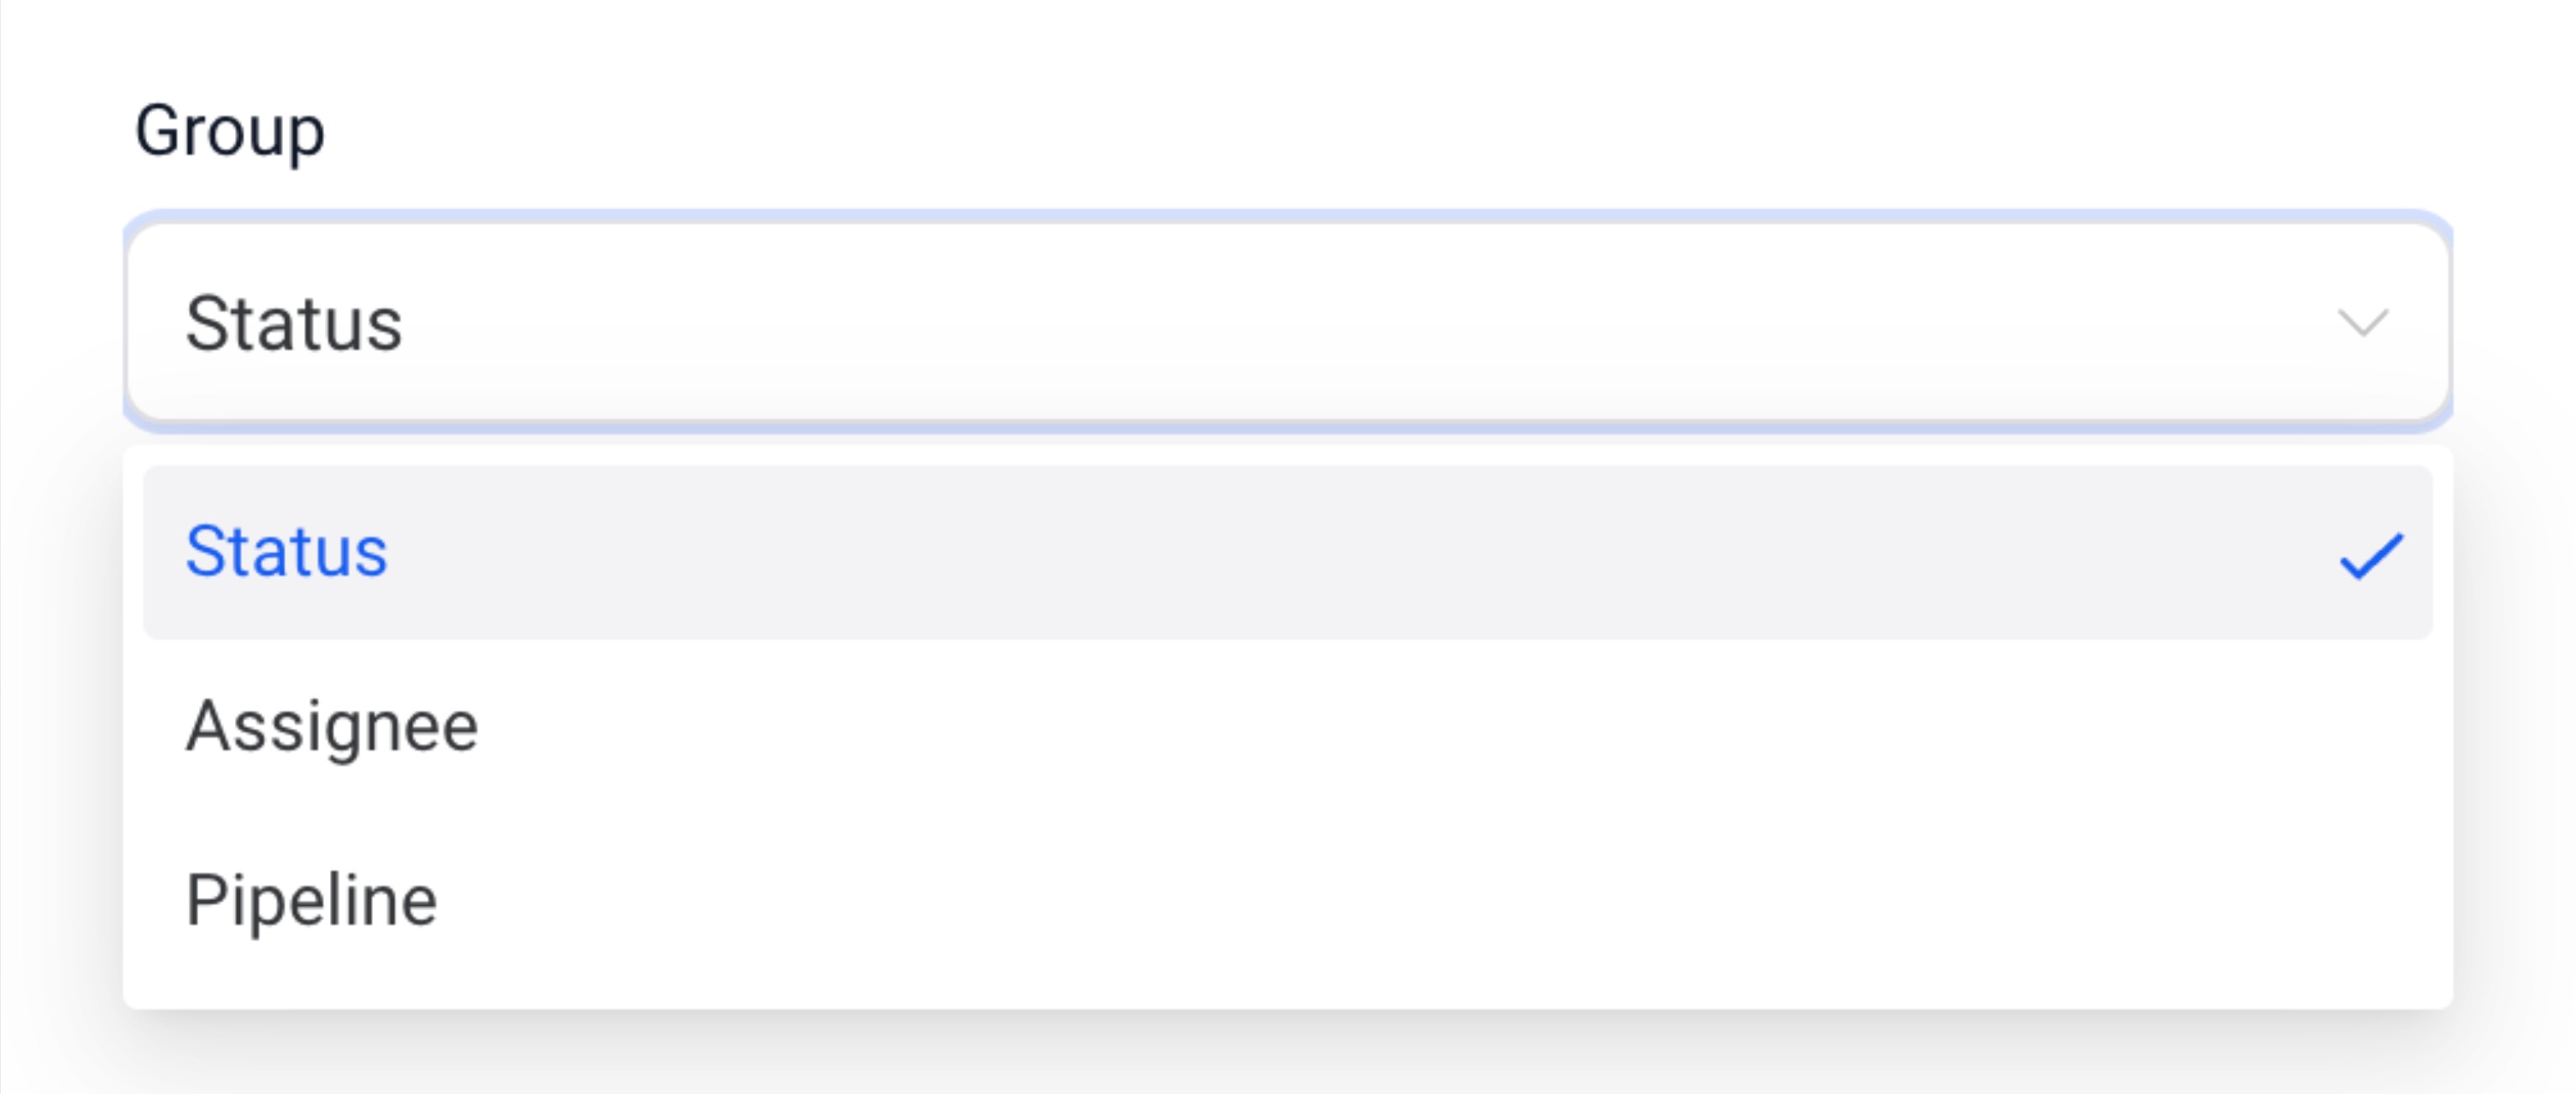
Group : Define how your results are grouped in a Donut chart.
View by : Pick the secondary dimension for line, bar and horizontal bar chart types.
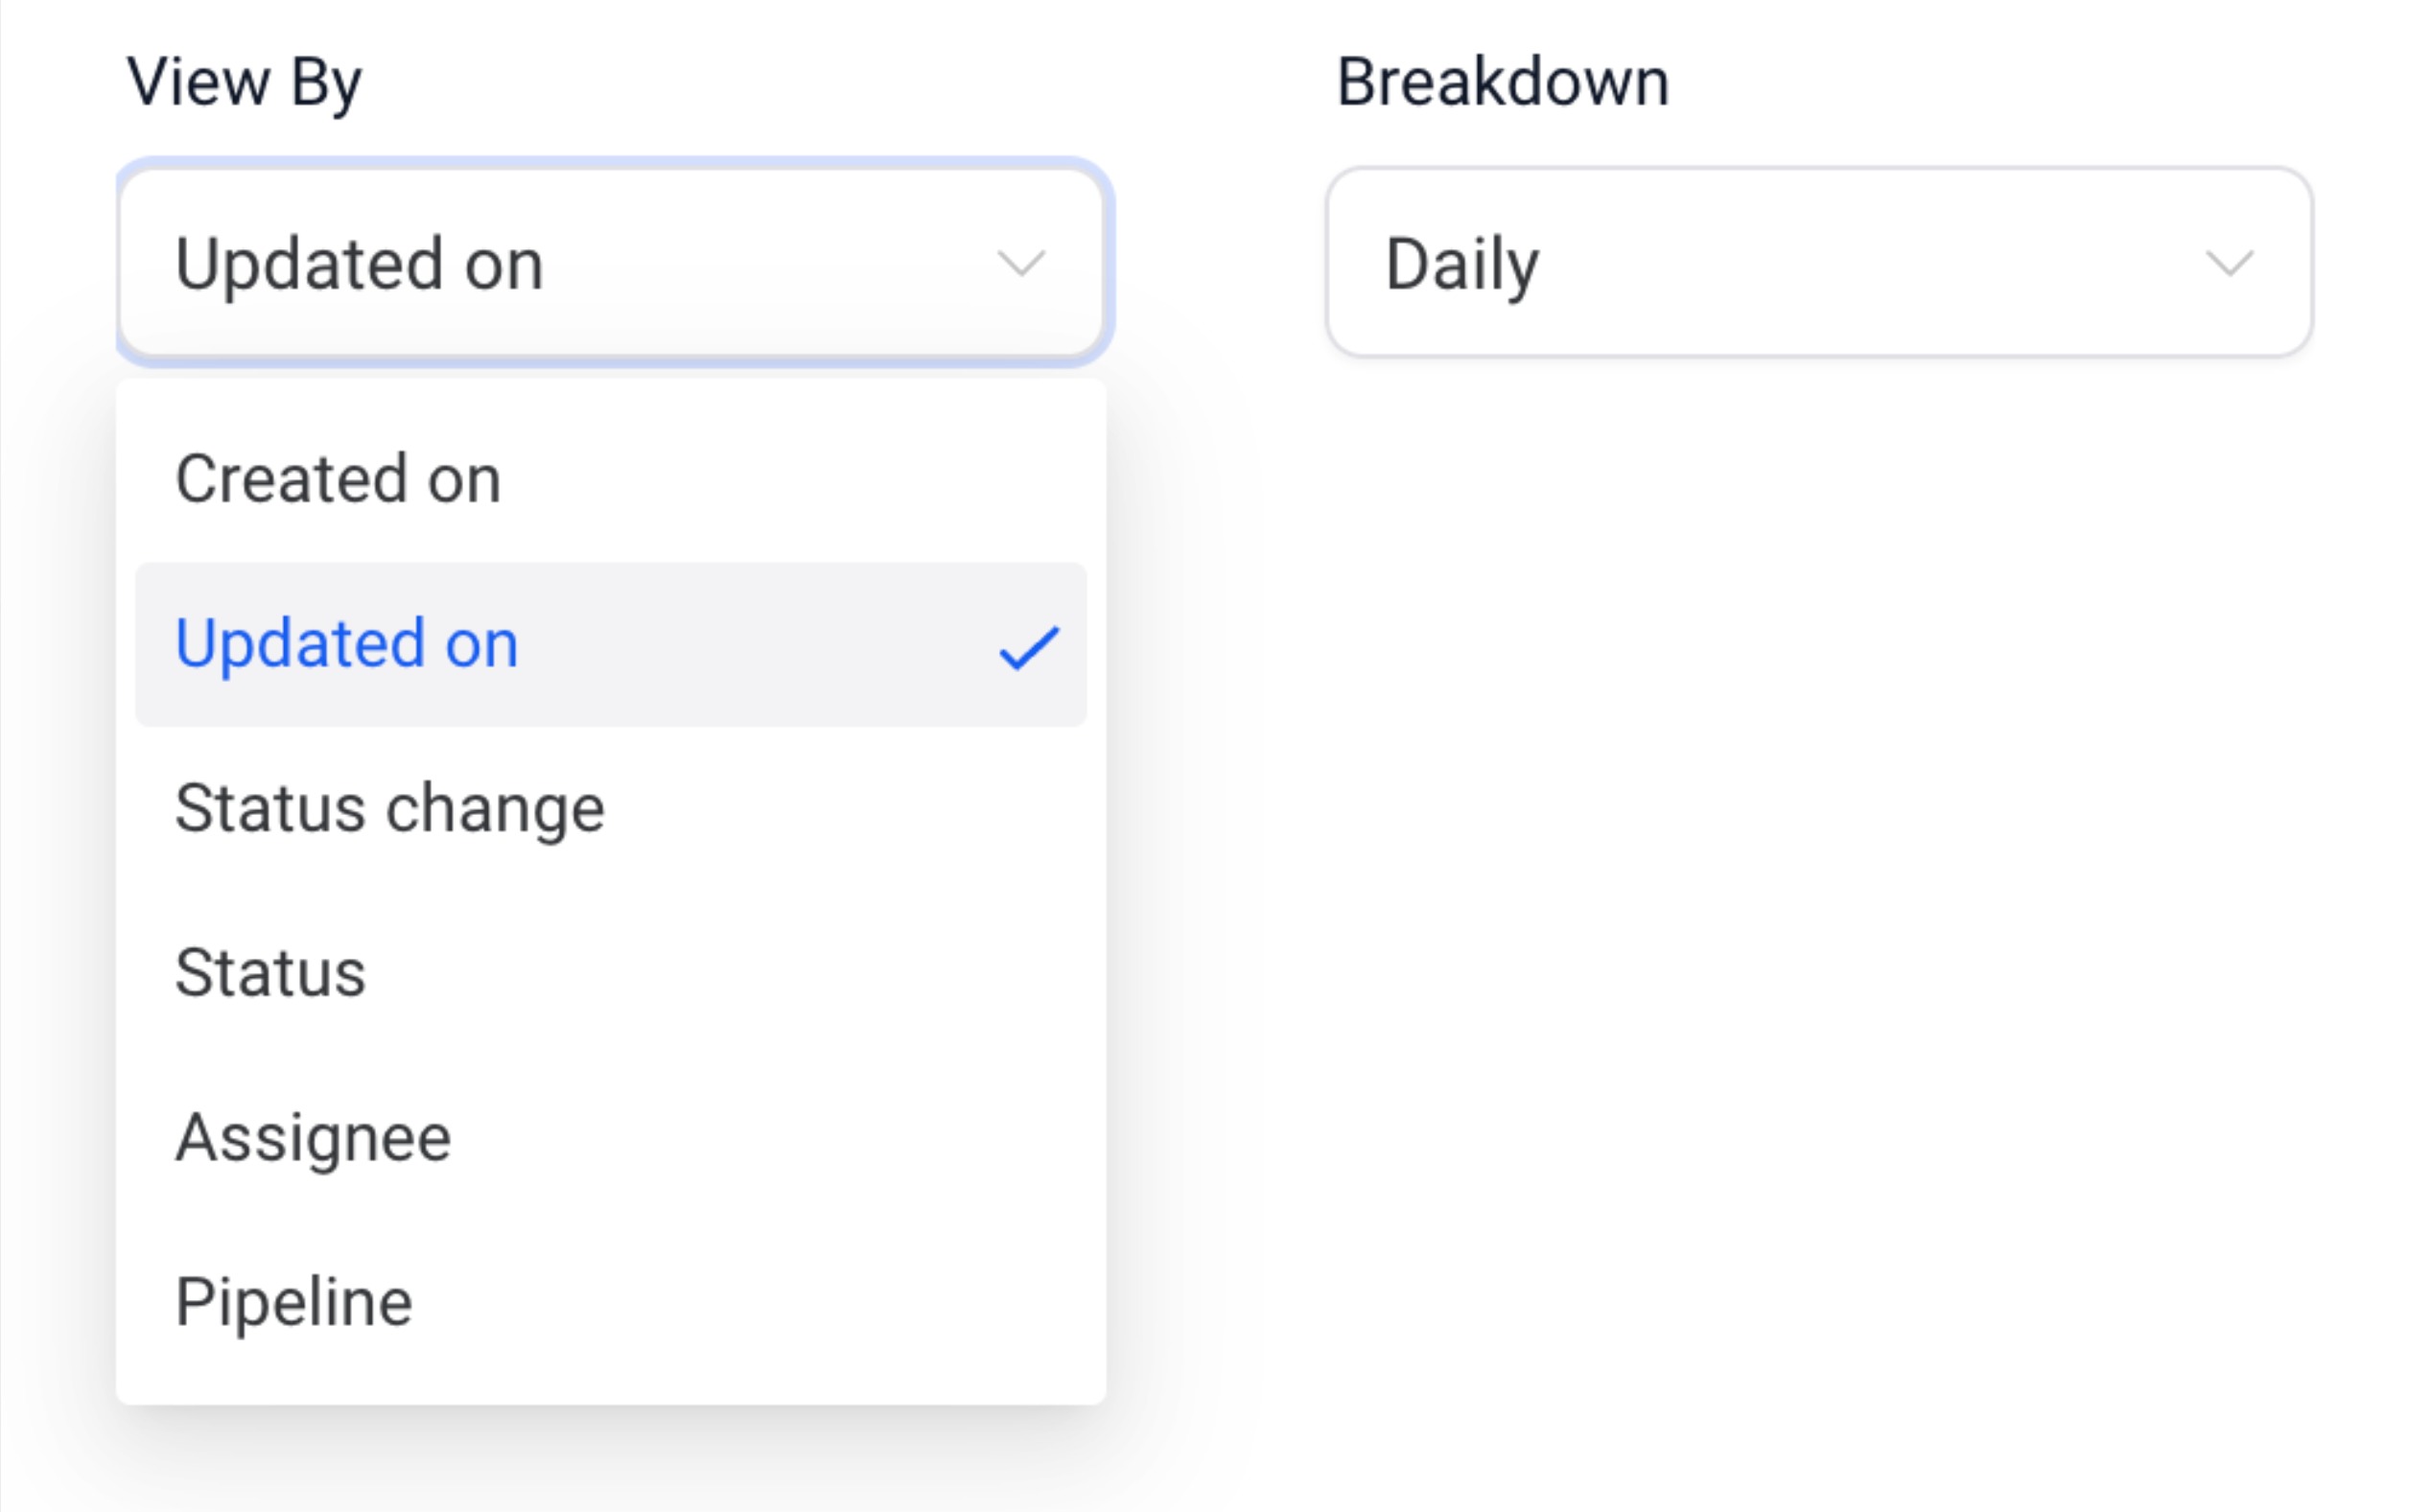
Breakdown : Modify the frequency of the time period.
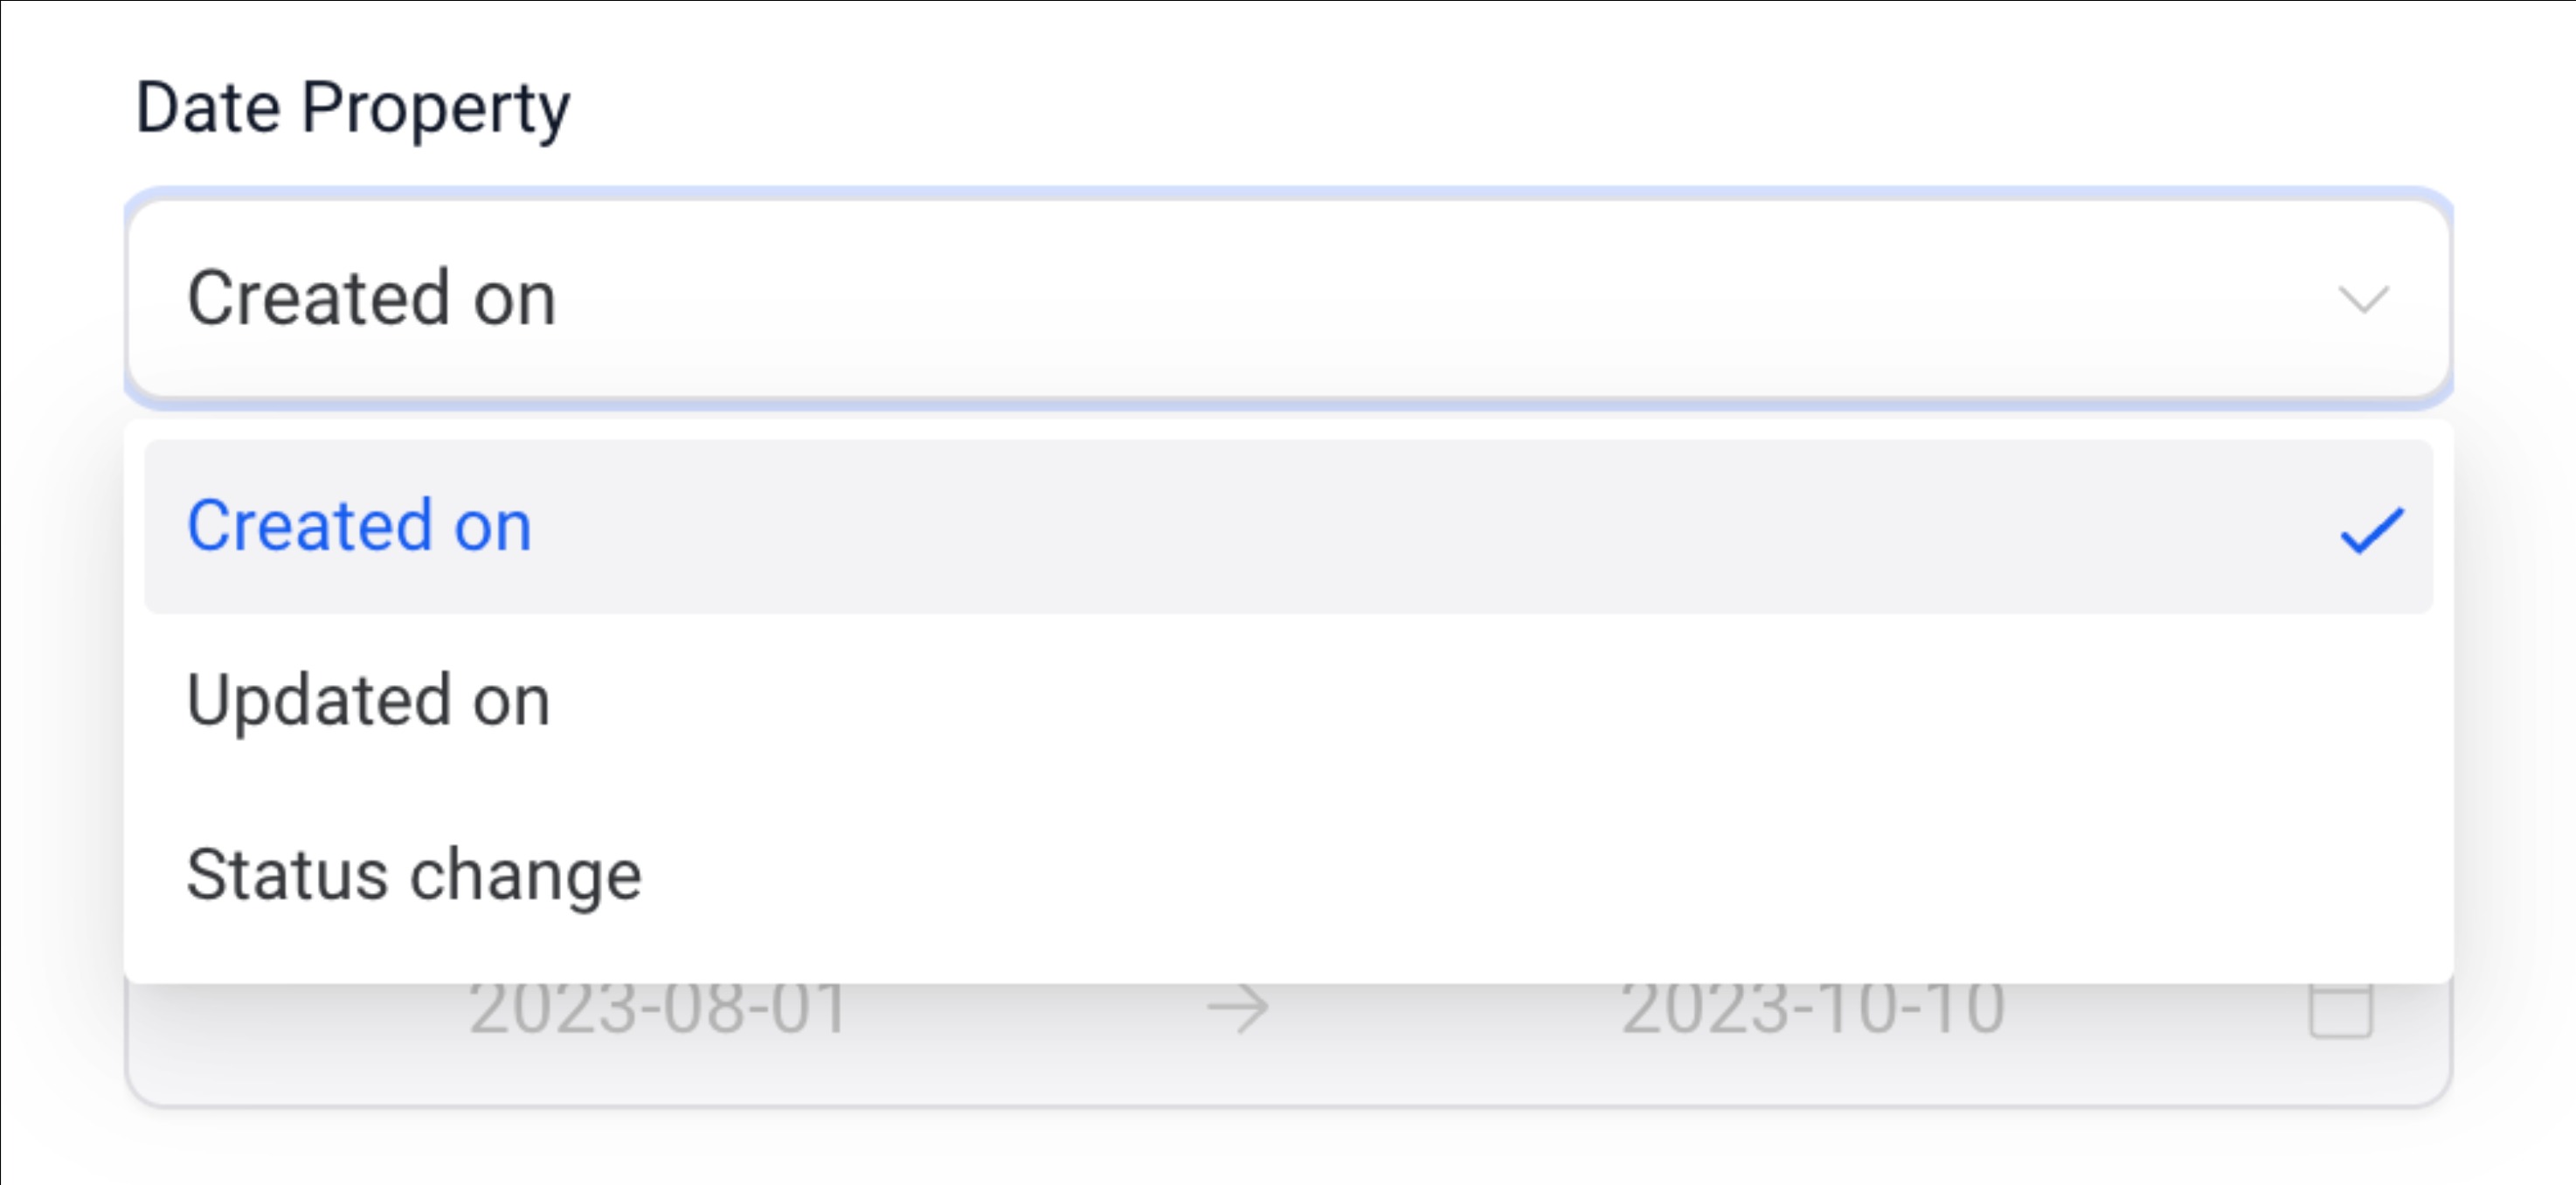
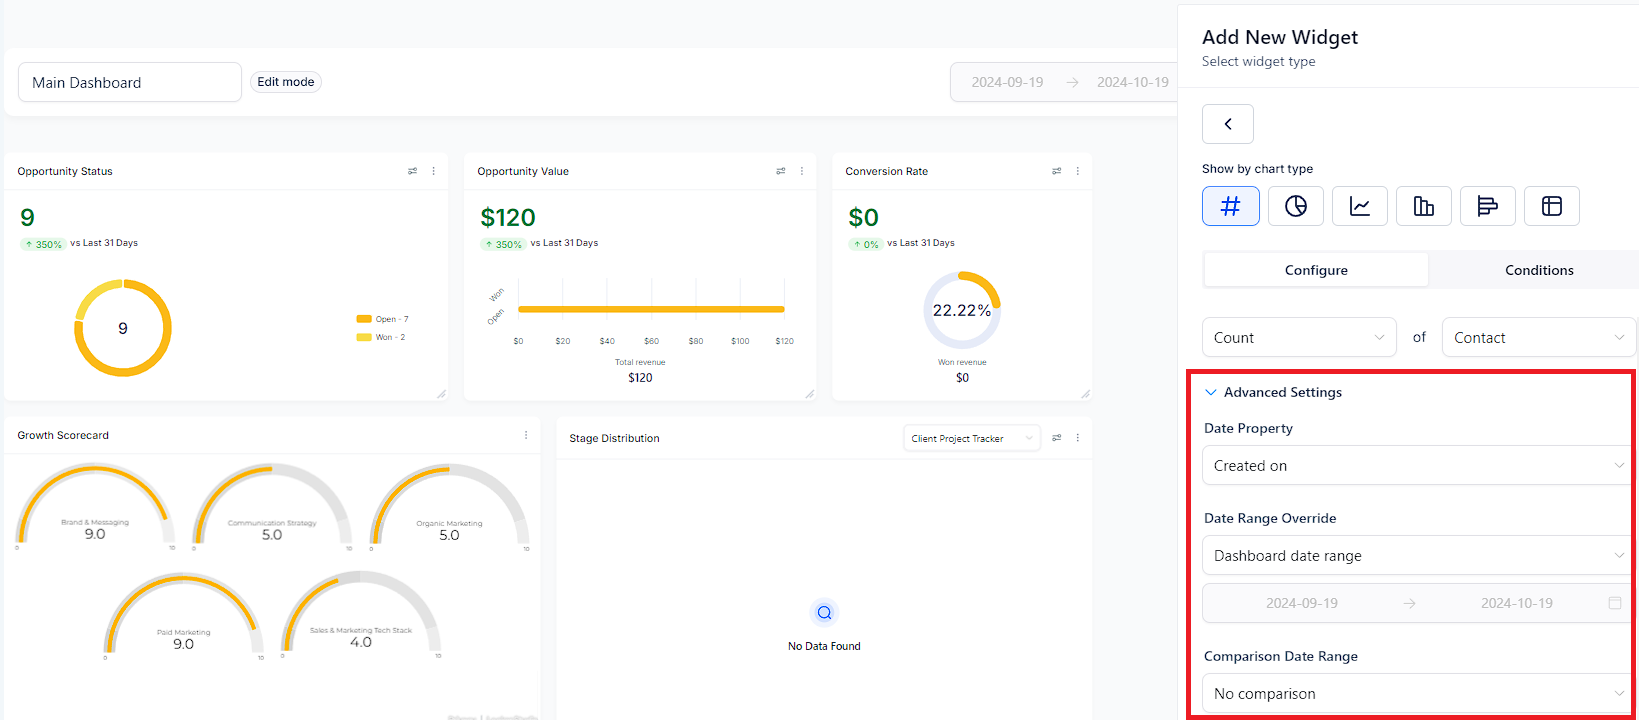
Date Property : Adjust the date property for fetching results(for example Created Date or Updated Date)
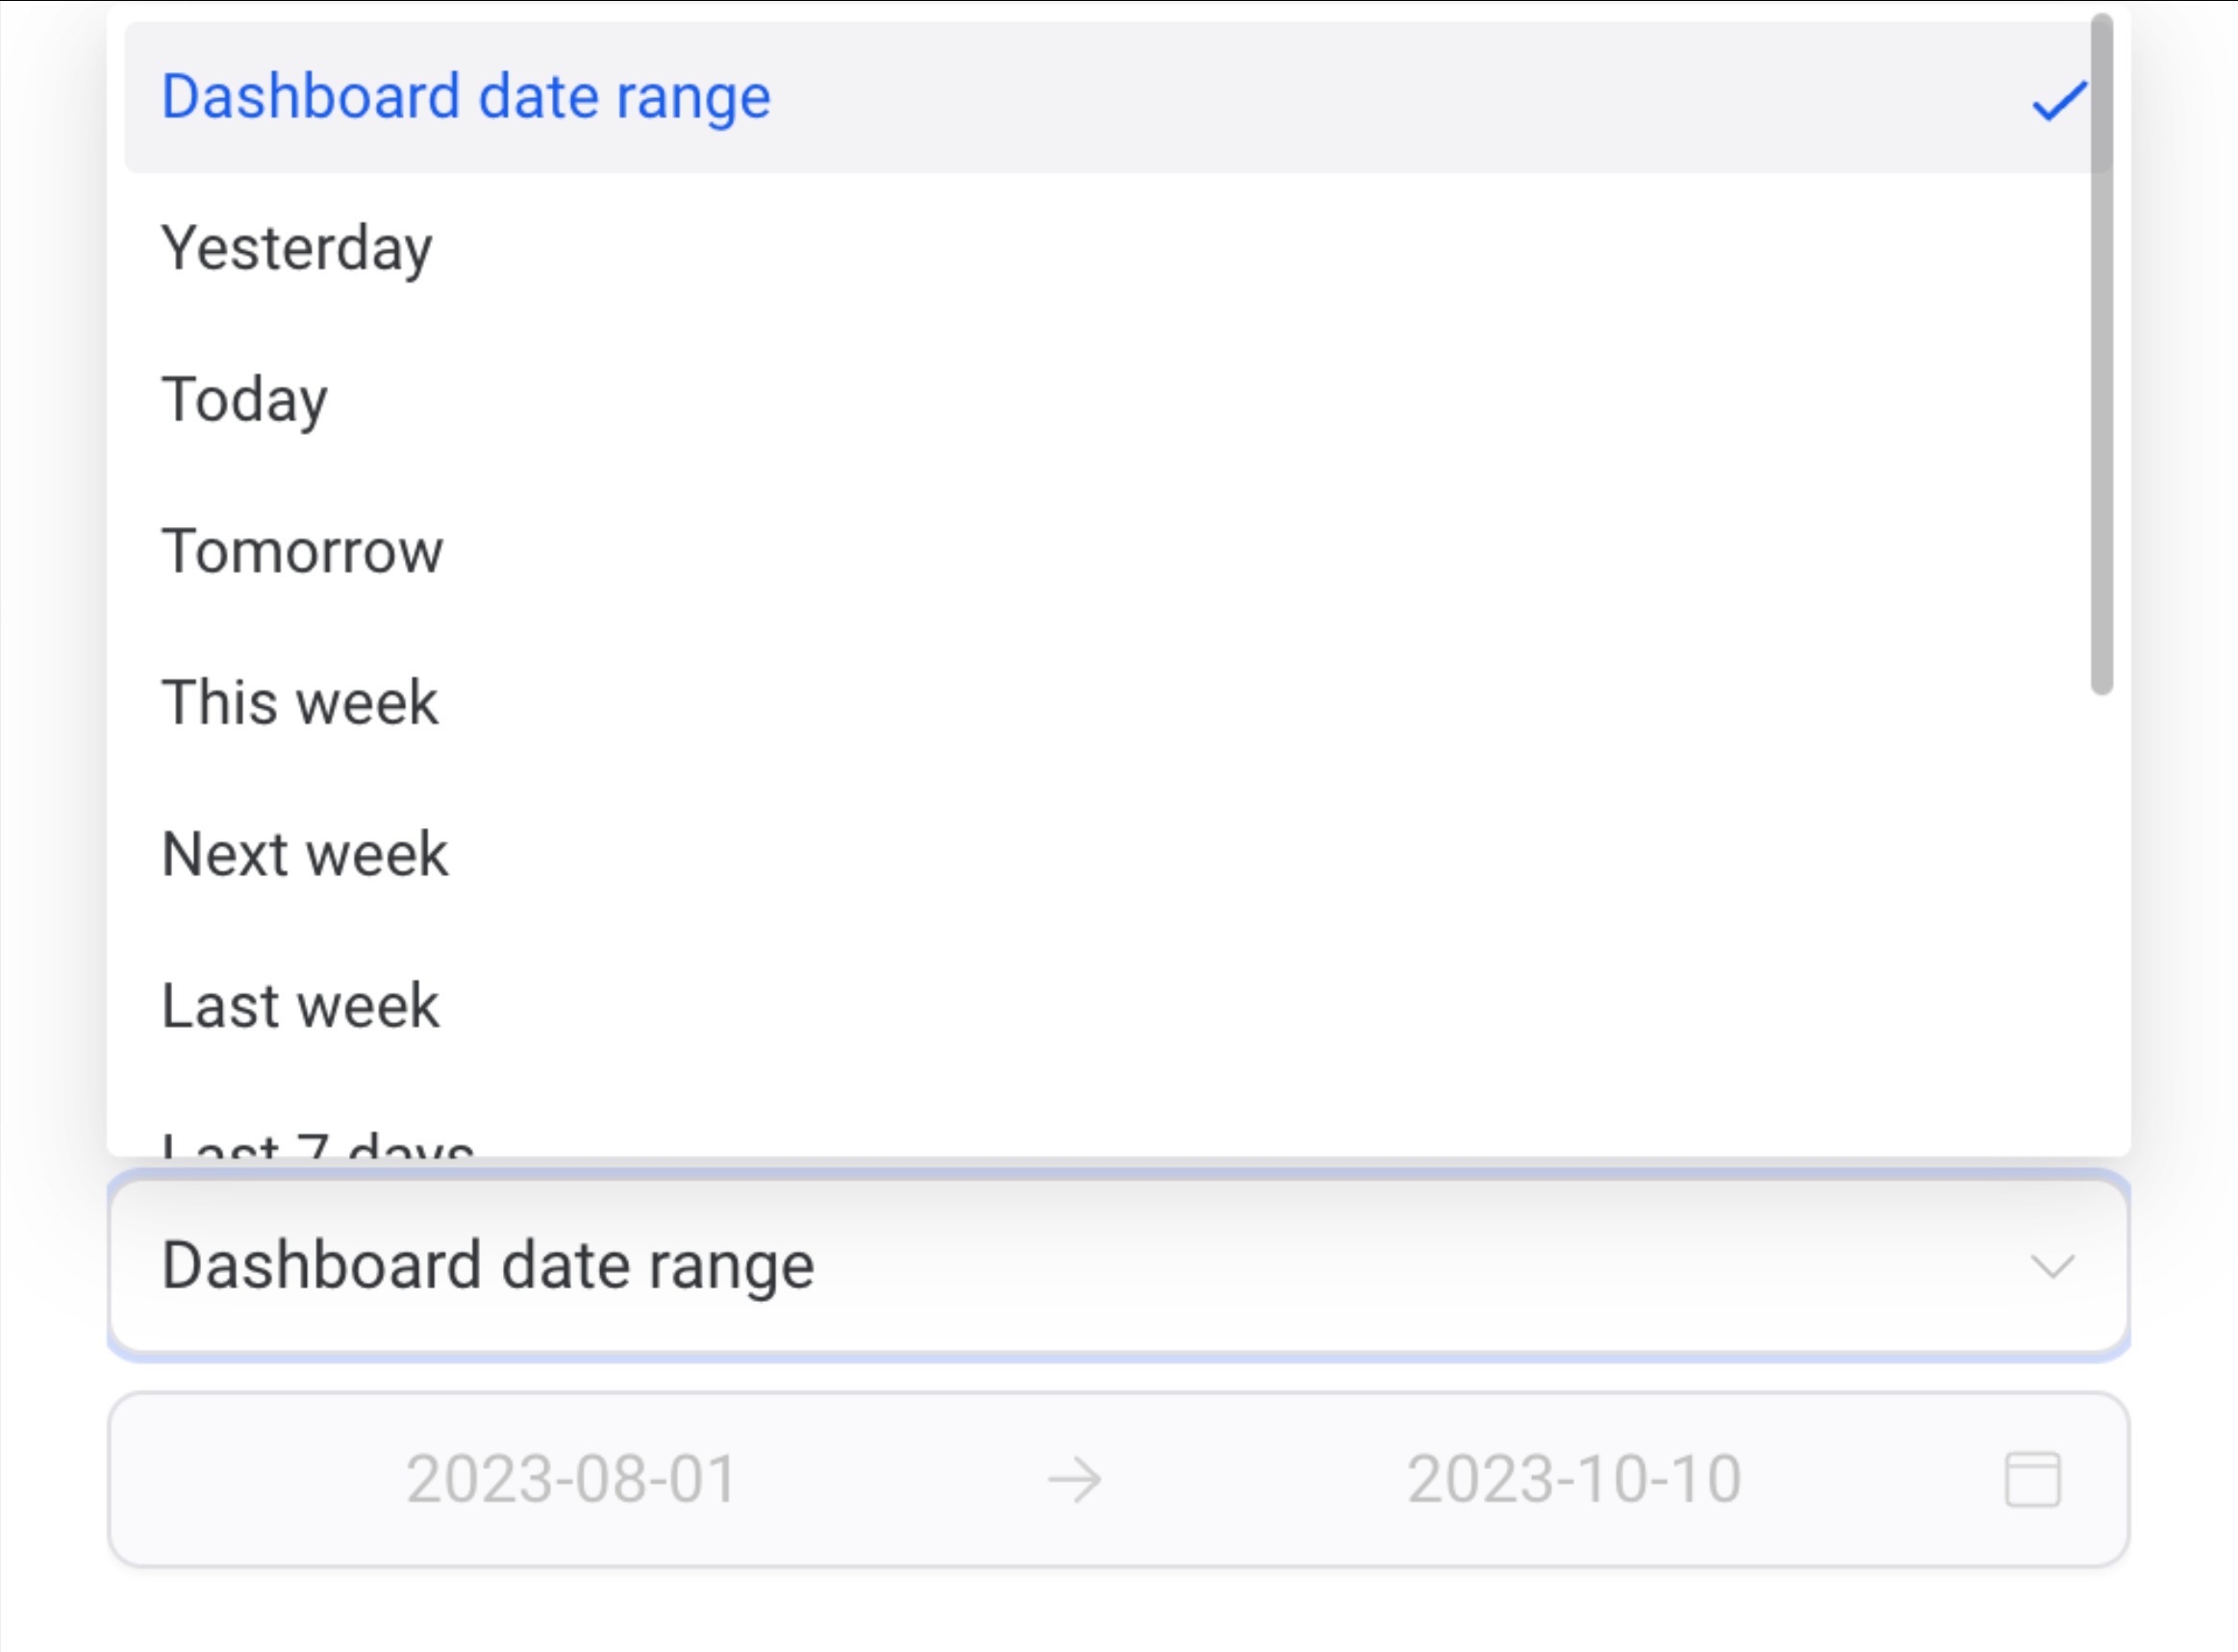
Date Range Override : Override the date range for the widget for the selected date property(by default, it uses the global date range from the dashboard).
Order : Alter the order of results (ascending or descending).
Limit : Set a limit to simplify the displayed results.
Advanced settings are supplementary configurations that offer extra personalization options for your widget. These settings are not mandatory for creating a widget but can enhance its customization.
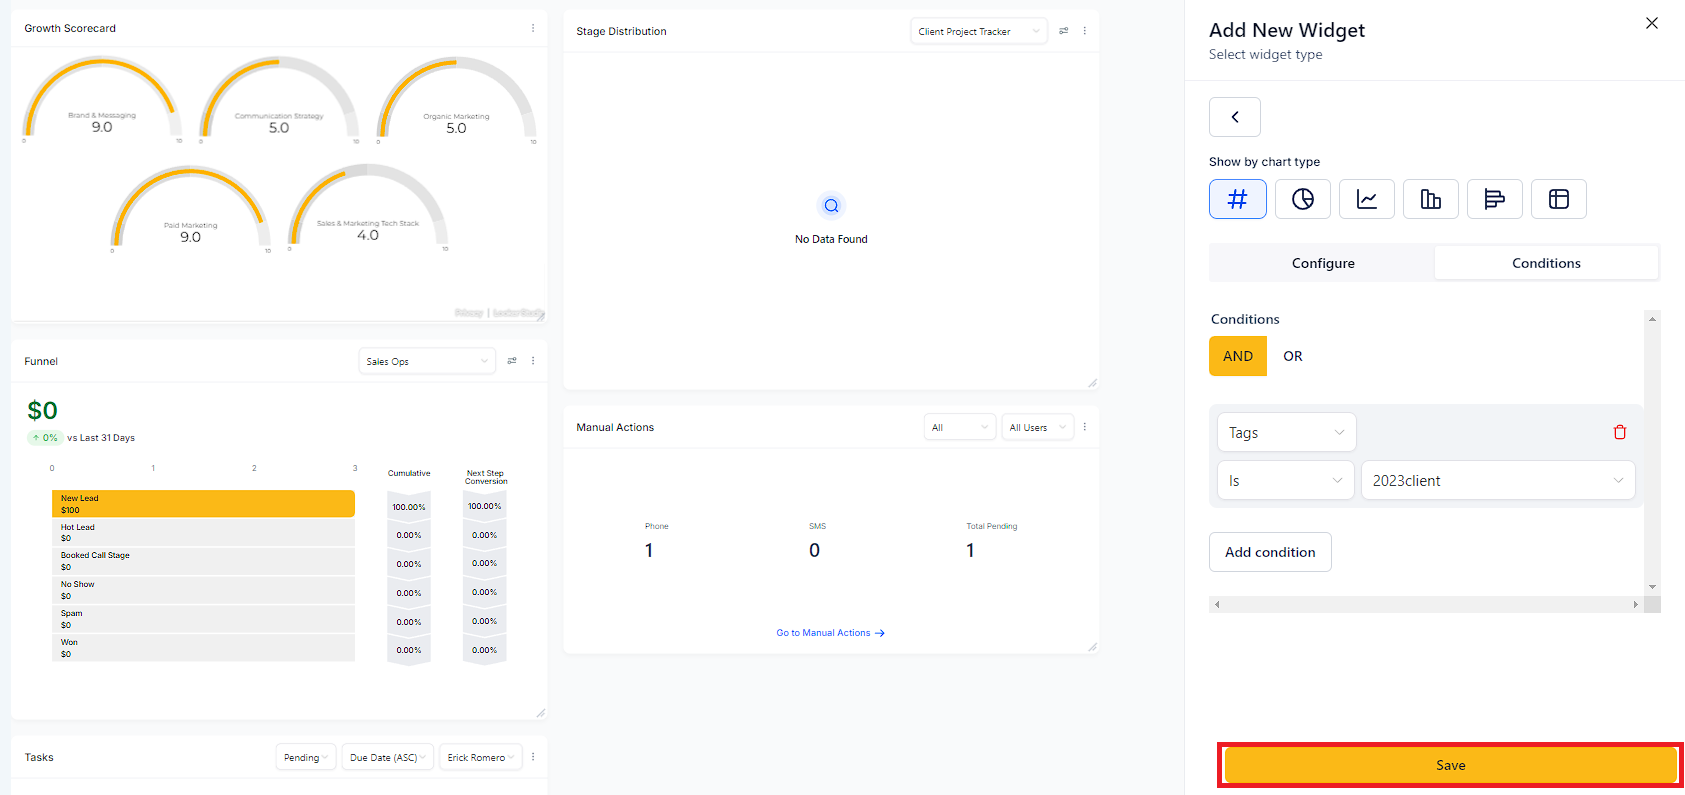
Under the "Conditions" tab, apply various filters using AND or OR conditions. Here's how:
Click "Add Conditions" to add a filter and choose the condition from the dropdown.
Set the operator and parameters for the filter.
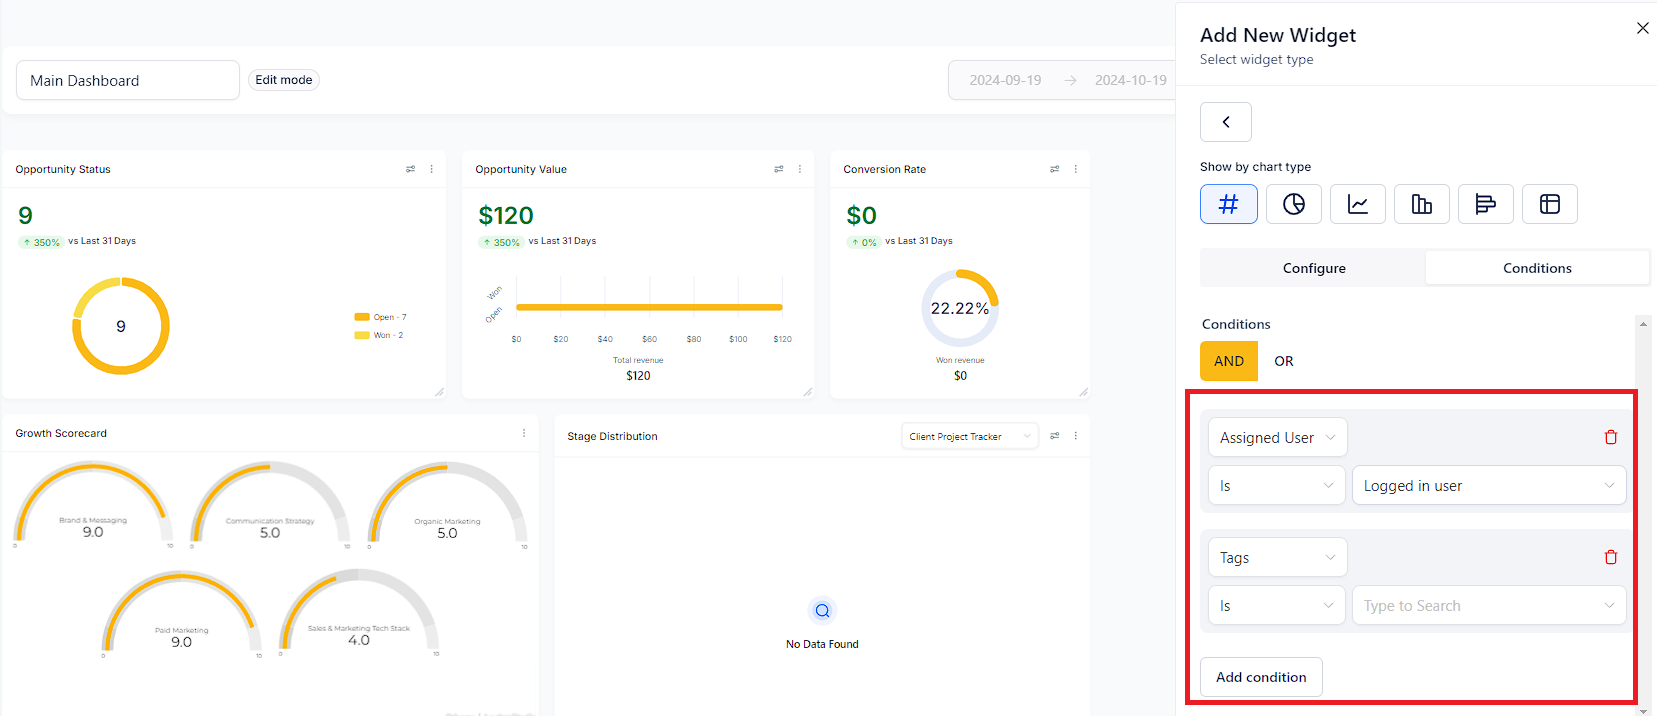
You can add or delete conditions as needed.

After making all the required changes, click the "Save" button.
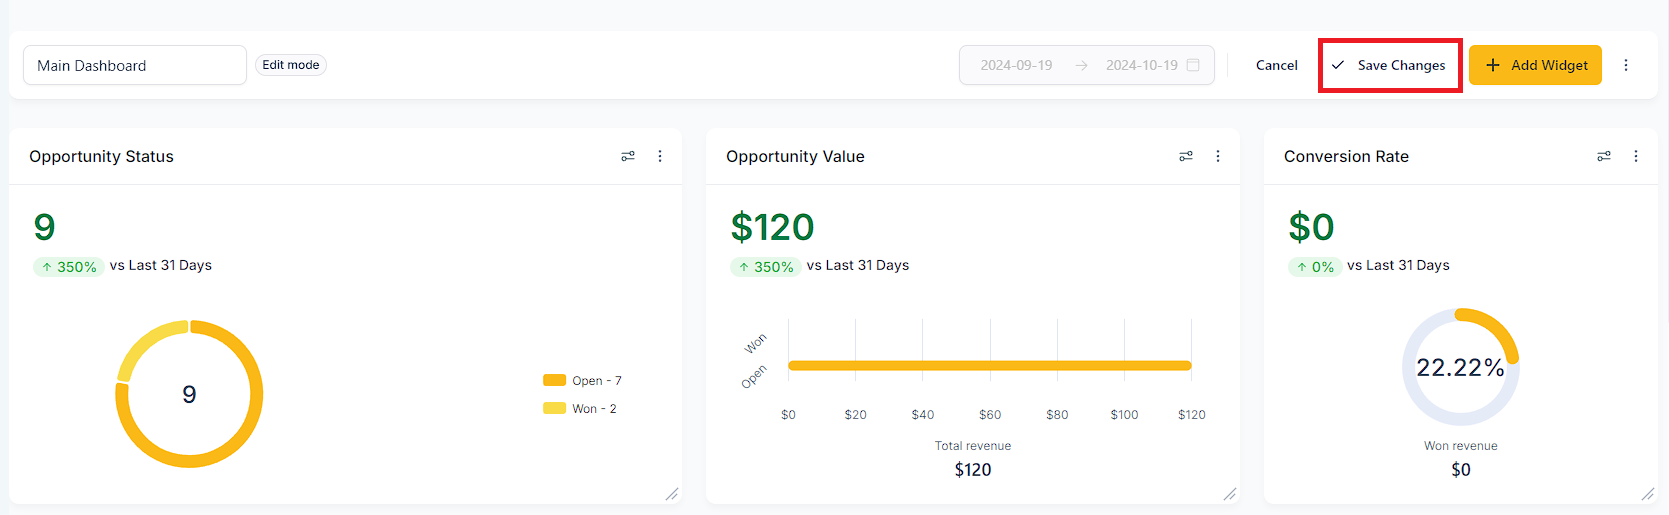
The widget will be updated on your dashboard. You can resize and reposition it as desired. Remember to click "Save Changes" once you're content with the widget's position and size.