Custom Metrics let Topline OS accounts create their KPIs by combining numbers from multiple data sources (like Contacts and Opportunities), applying formulas, and dropping the result straight into Dashboards and Custom Reports. It’s snapshot‑compatible and designed to replace spreadsheet hacks, so teams can align on the exact definitions that drive the business.
Create custom KPIs by mixing metrics from multiple sources
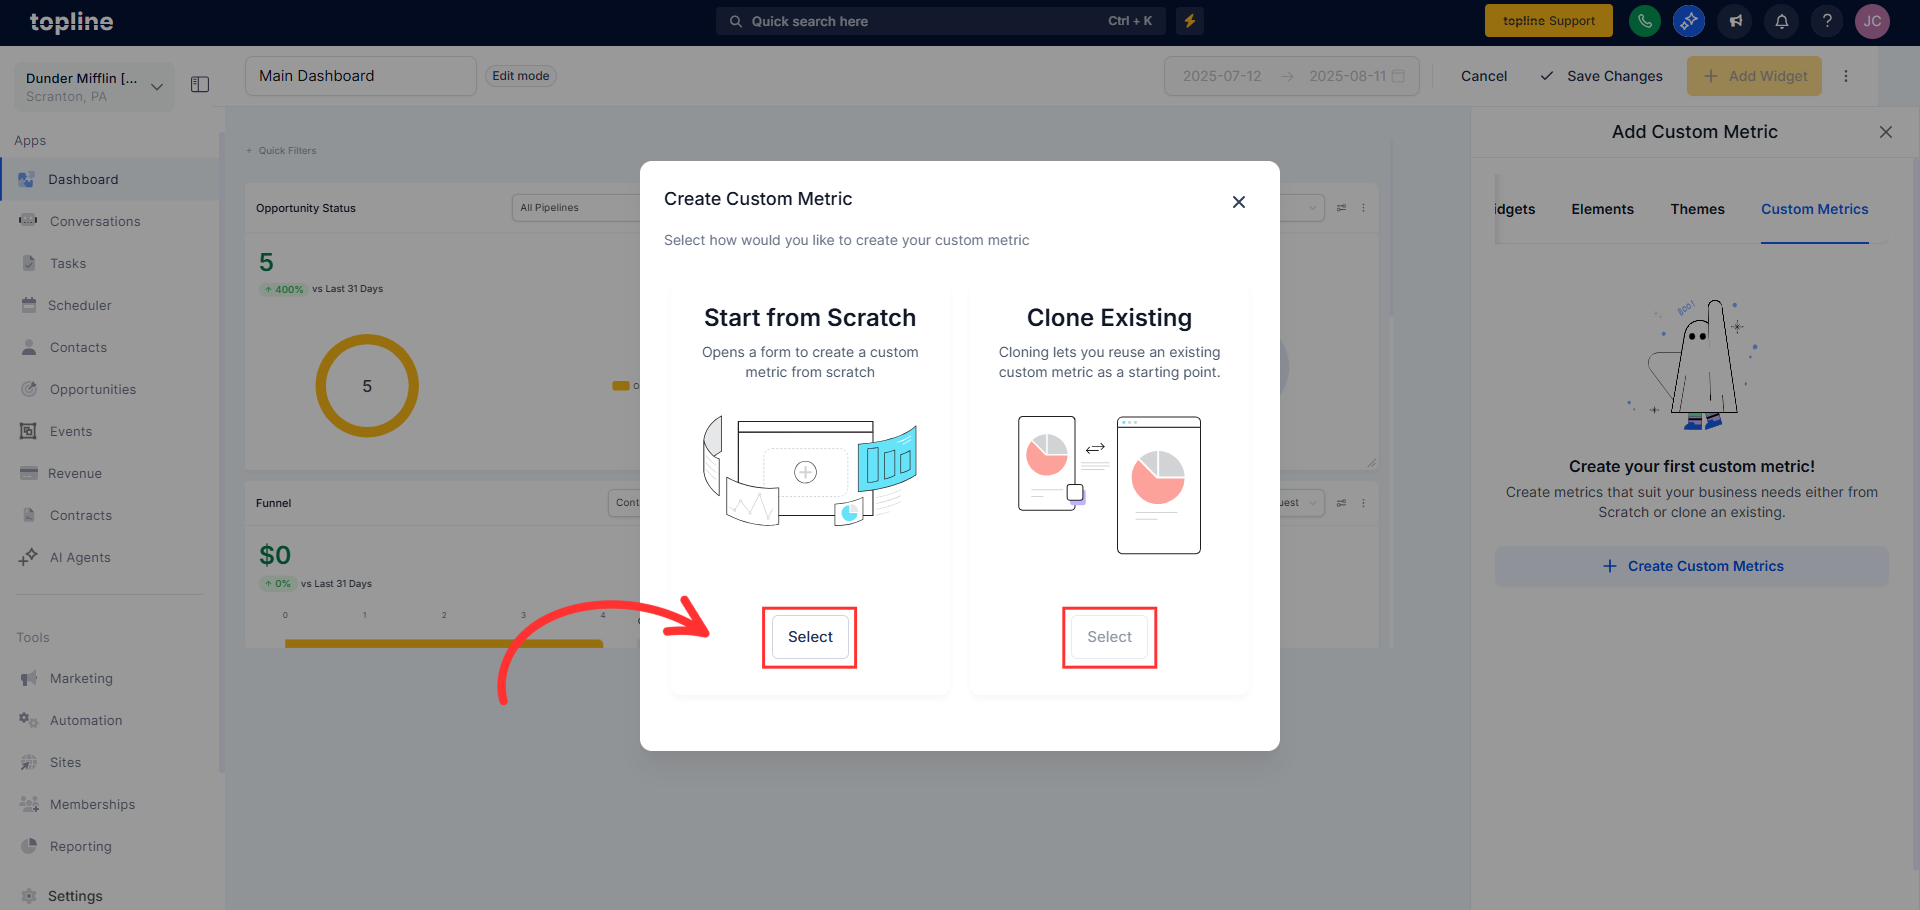
Start from scratch or clone an existing metric.
Smart formula editor with live validation, operators, and numeric constants
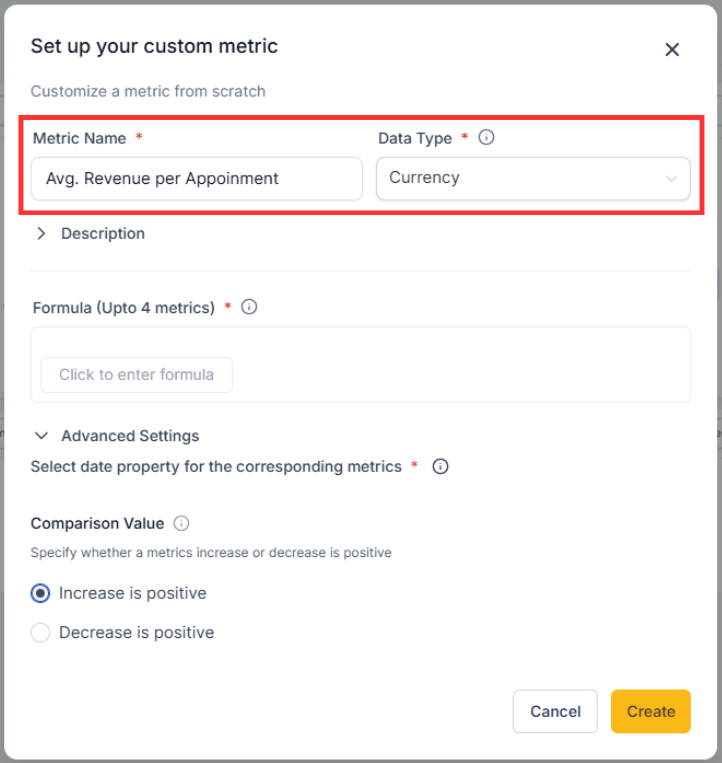
Data types: Integer, Float, Currency, Percentage
Trend direction control: mark “up” as good or bad for each metric
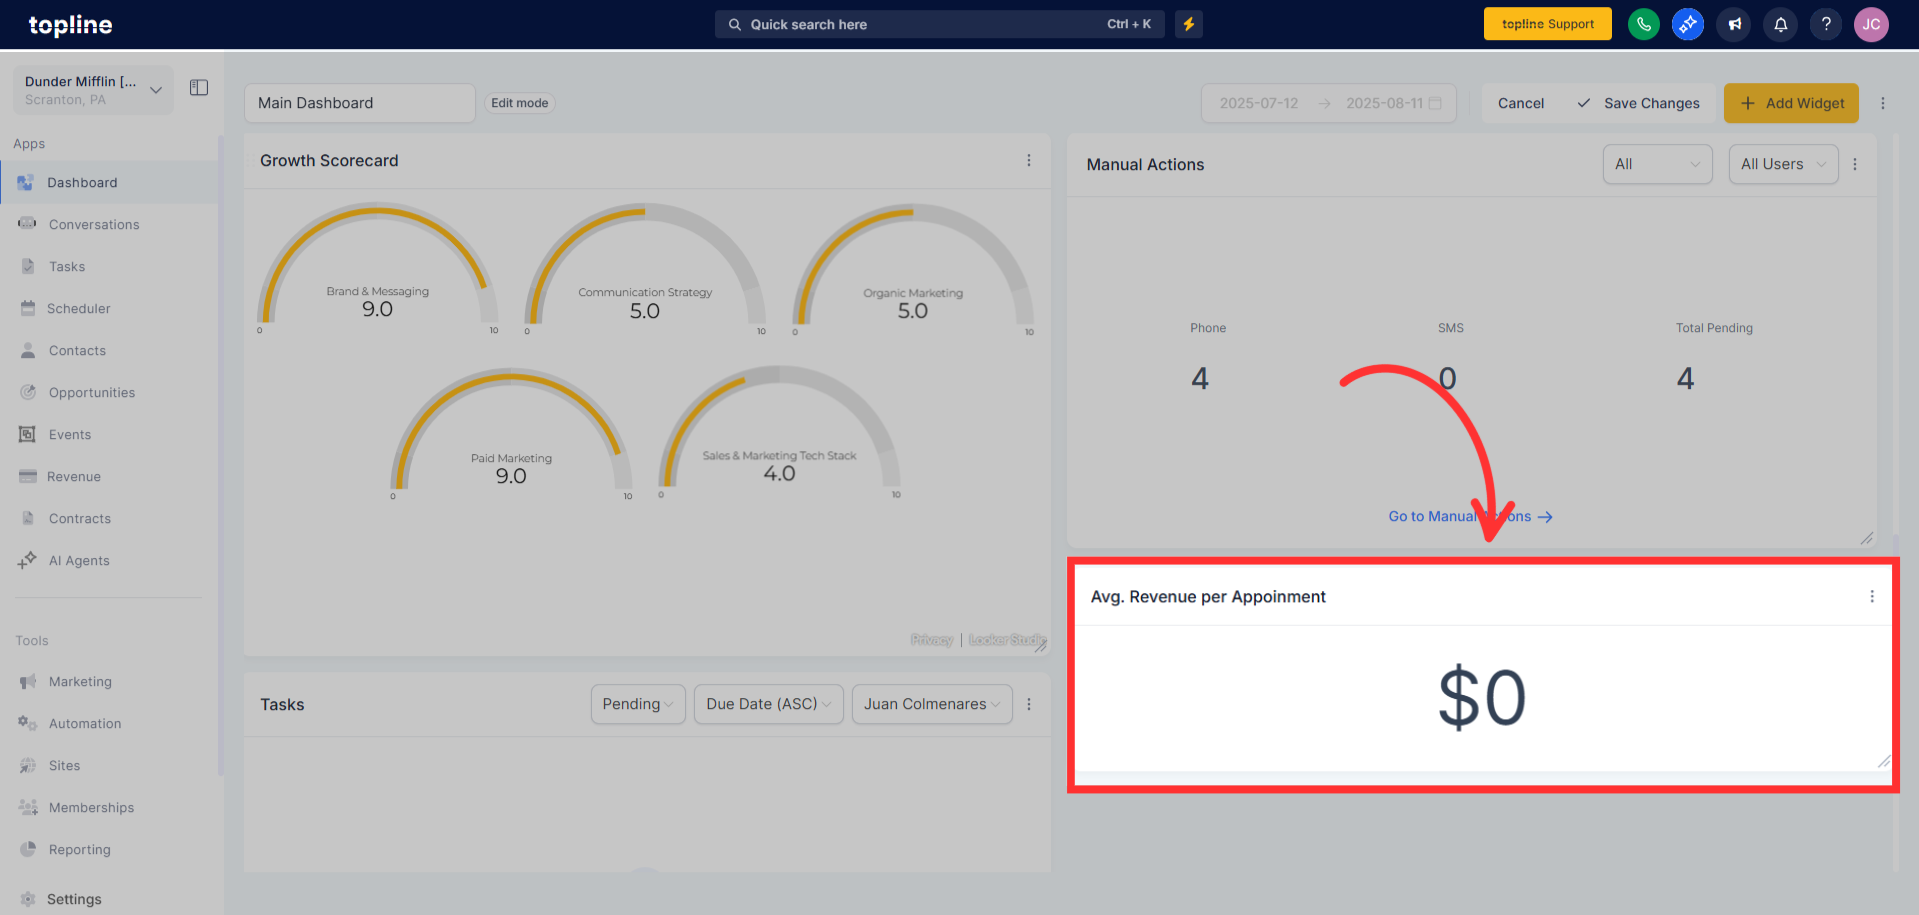
Works everywhere: add as a widget to Dashboards and Custom Reports; snapshot‑compatible
Chart options: rename, theme, and optionally compare to the previous period
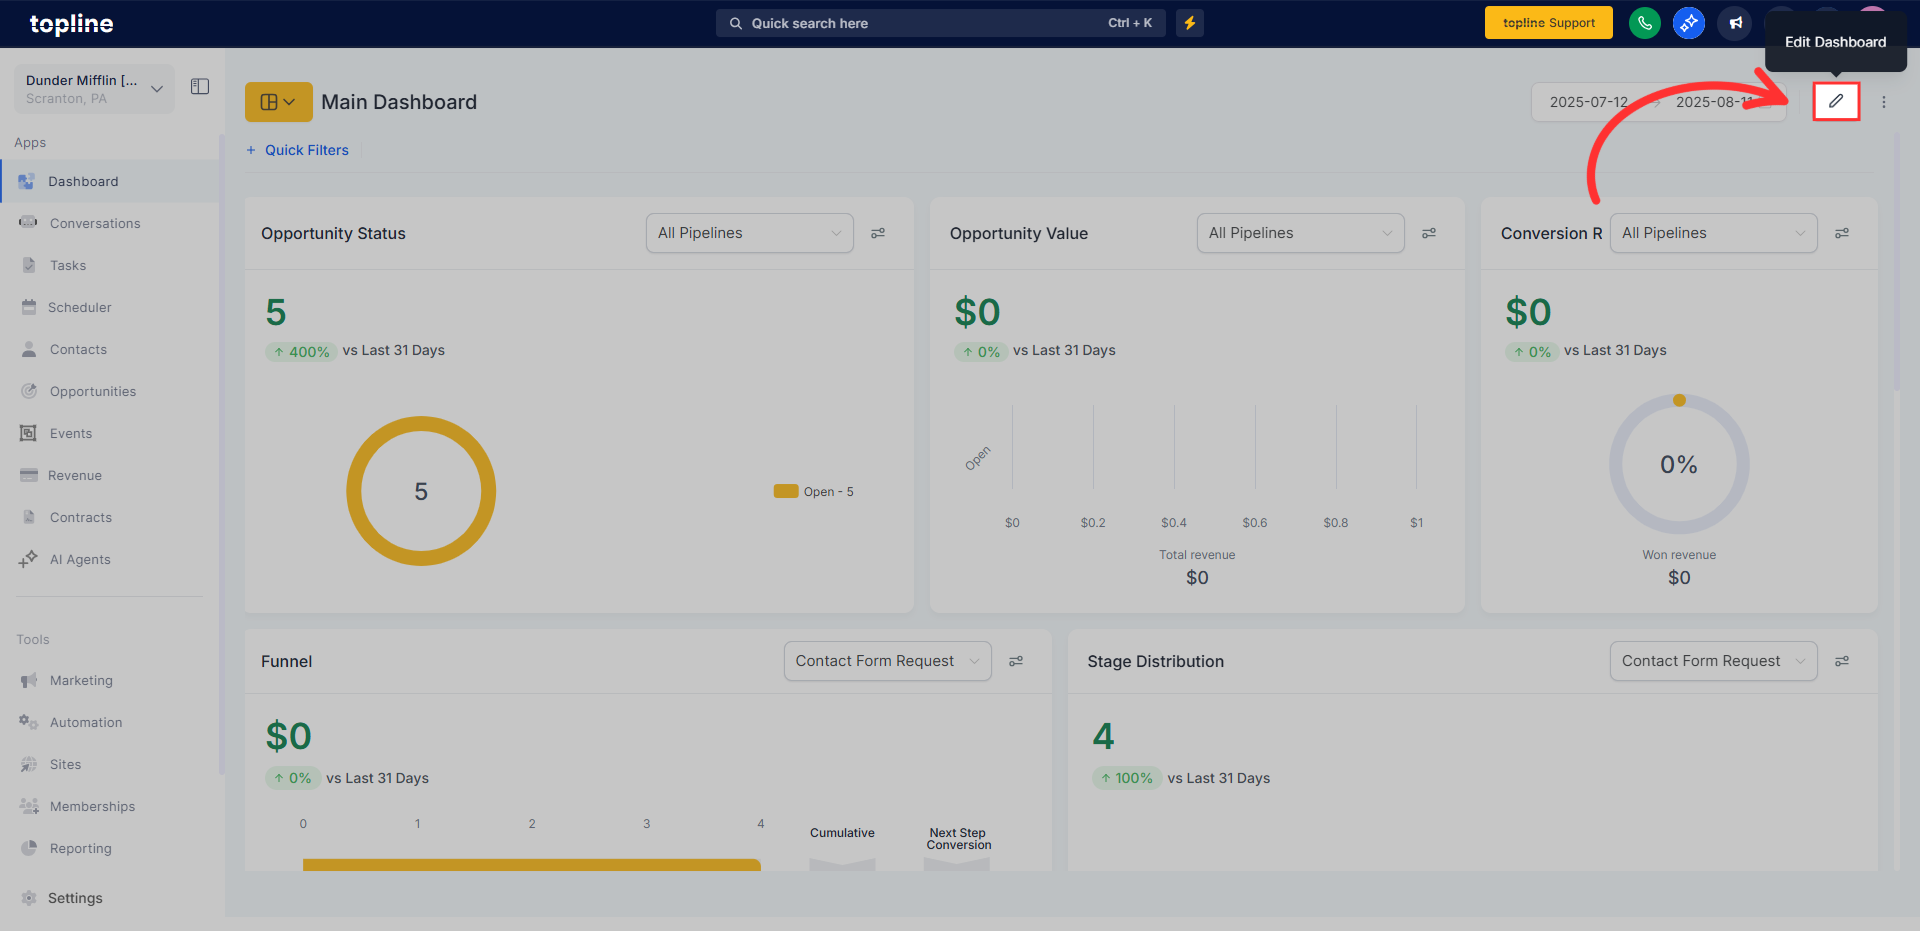
Open a Dashboard (or a Custom Report) and click Edit.
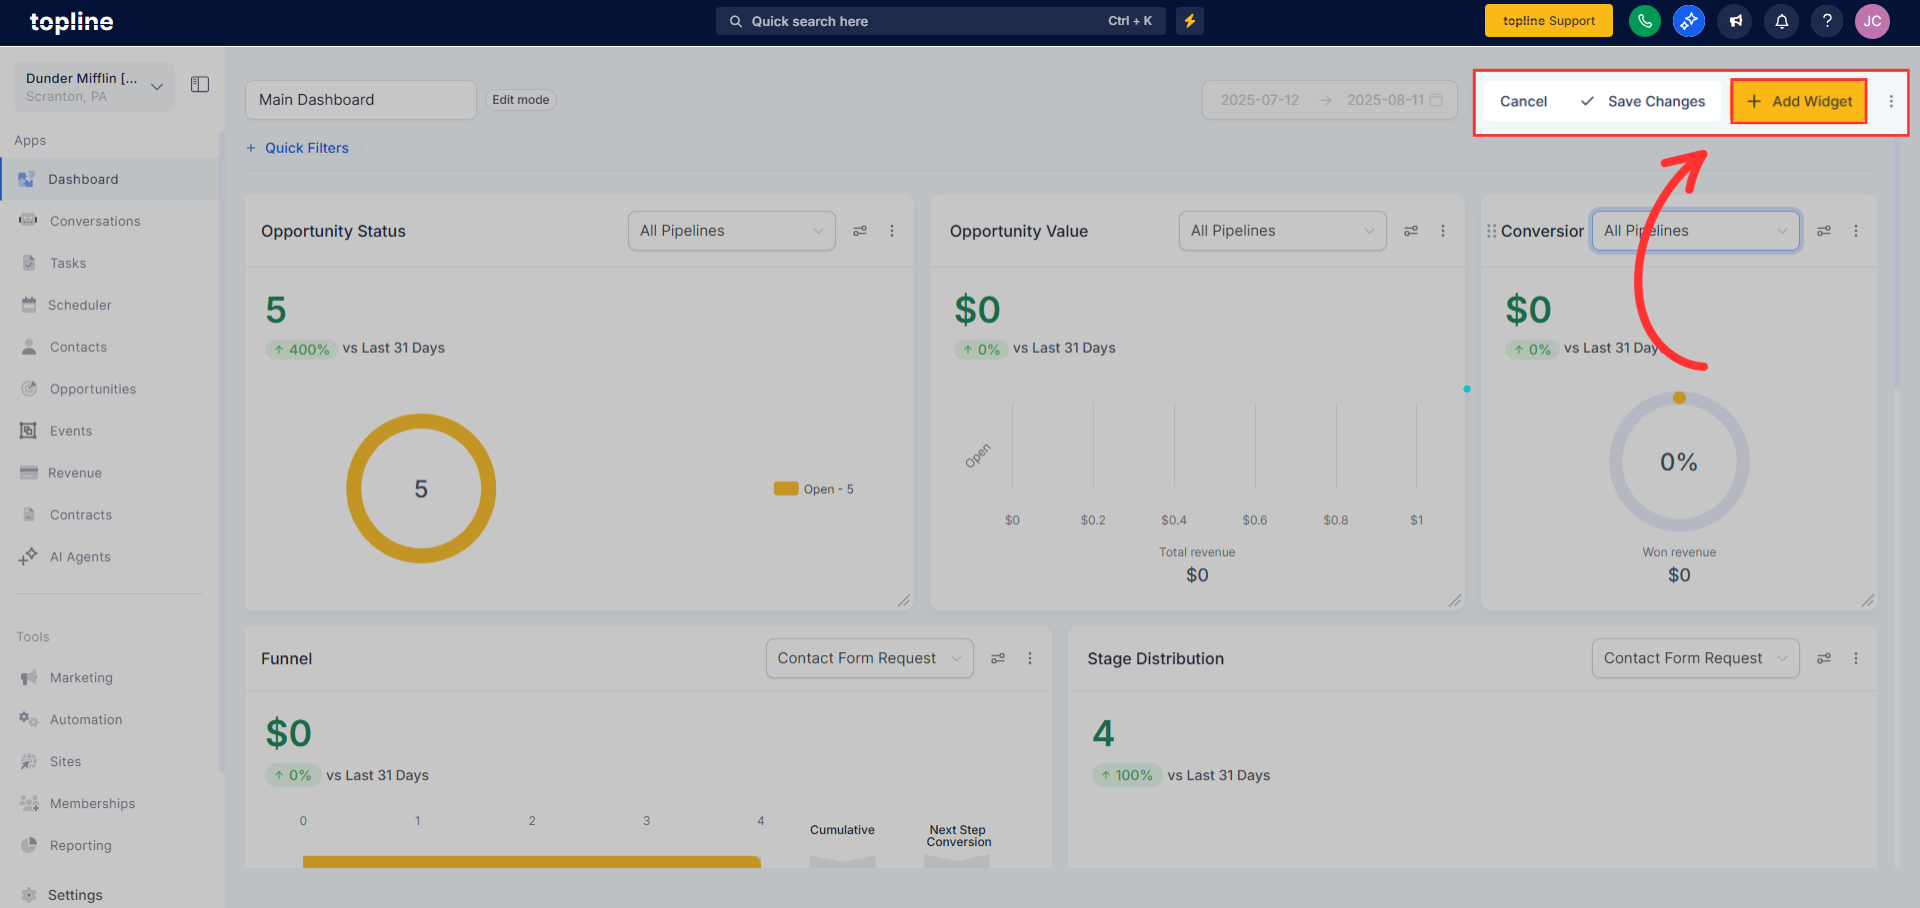
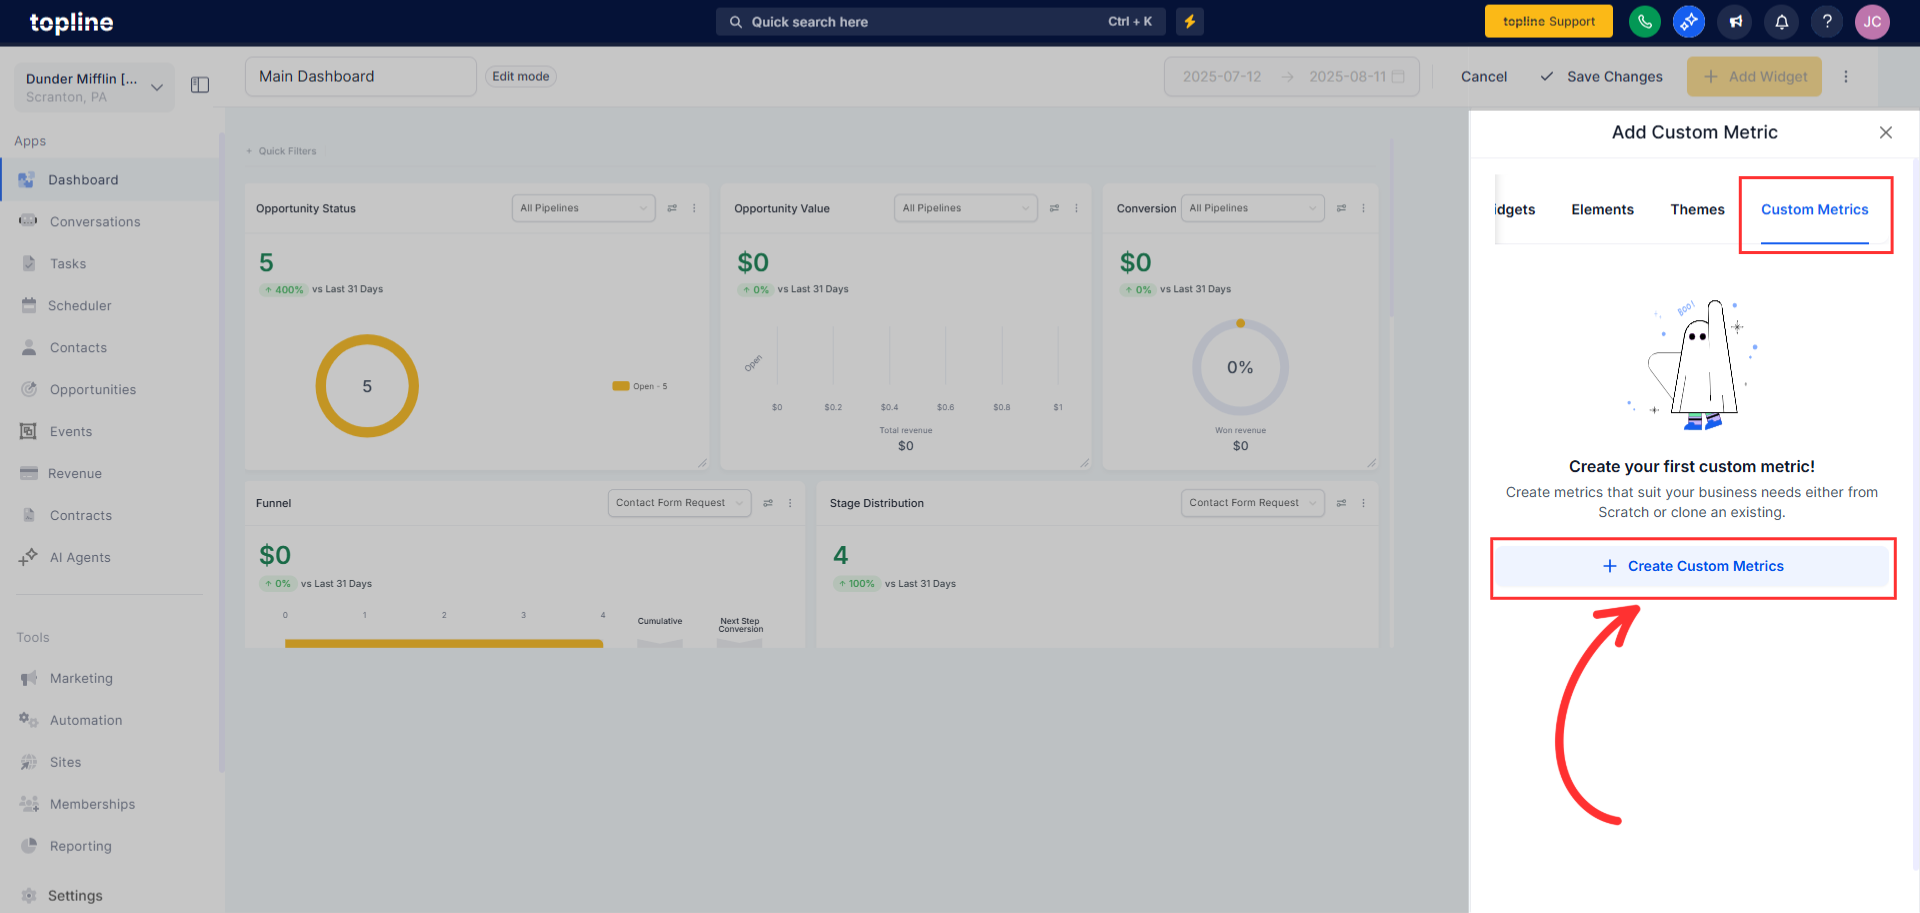
Click Add widget and choose the Custom metric tab.

Create a Custom Metric and pick From scratch or Clone.
Create a Custom Metric and pick From scratch or Clone.
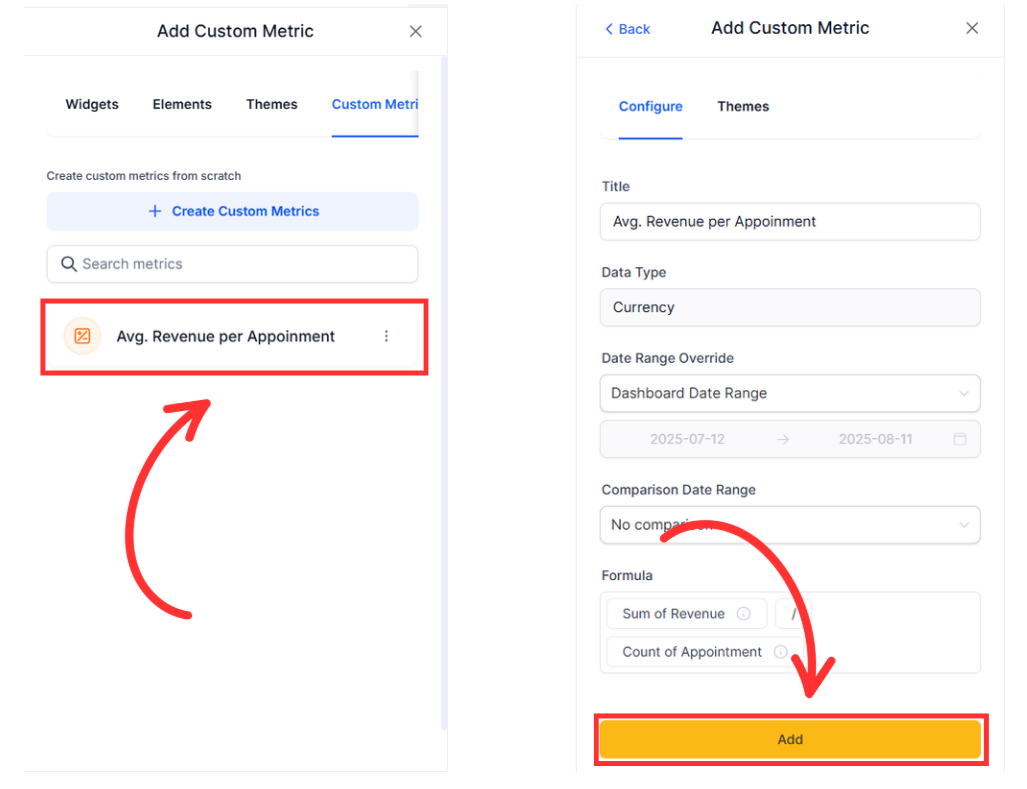
Define Name, Data Type, Description, and Trend direction.
Build your Formula by inserting metrics and operators, then validate.
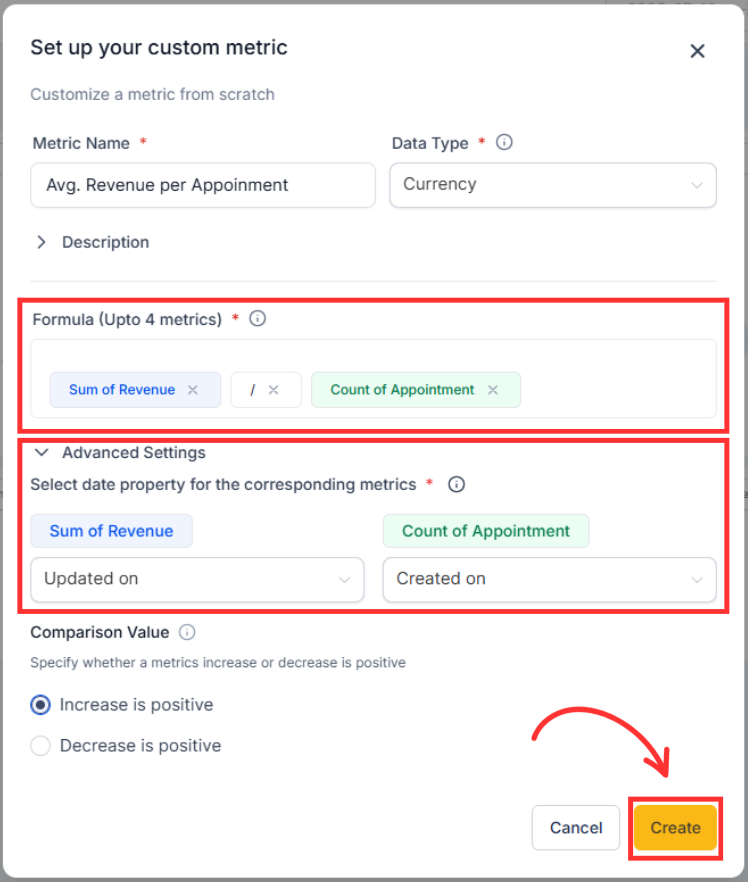
Save, then configure the widget (name/theme/compare to previous period) and add it to your dashboard.