Topline OS adds blog statistics so you can monitor views, spot trending posts, filter by date range, and export results for reporting. Use it to learn what readers engage with and improve future posts.
Blog statistics view with key metrics and trends over time
Top posts list to see what is performing best
Date range filters and quick presets for faster analysis
Post-level details so you can evaluate individual pieces
CSV export for external reporting and sharing
Compare recent periods to see whether changes in titles or thumbnails are working
Use consistent naming and tags so you can group related posts in filters
Pair posts with clear CTAs and trackable links to connect content to outcomes
Step 1
Open Sites → Analytics and click on the select to pick Blogs.
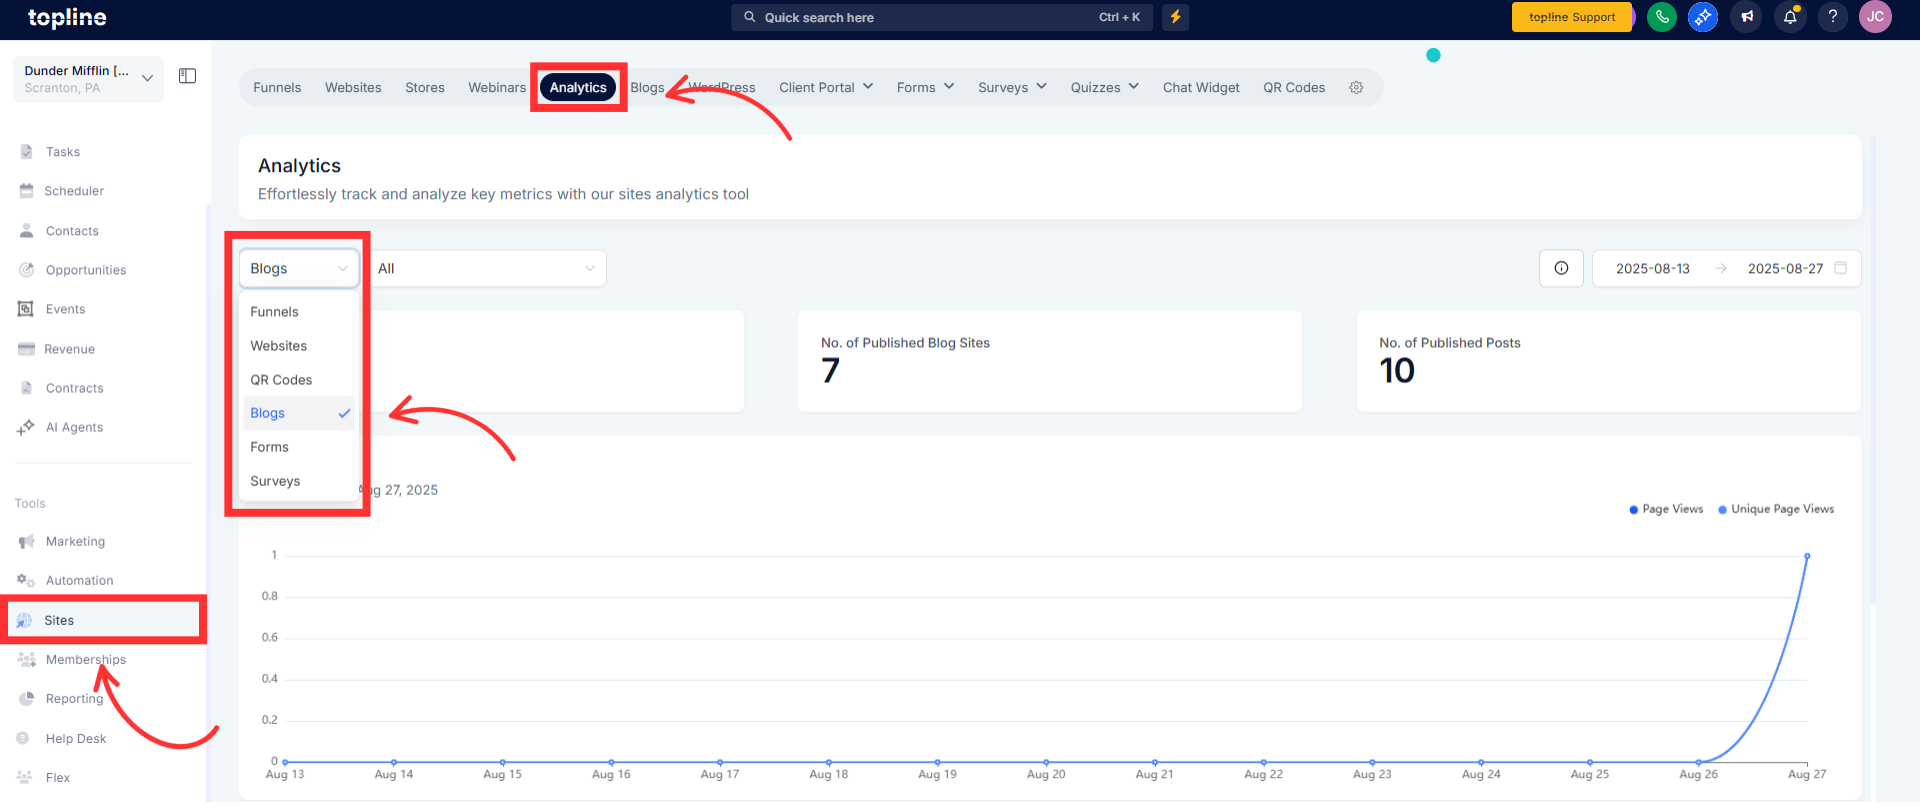
Step 2
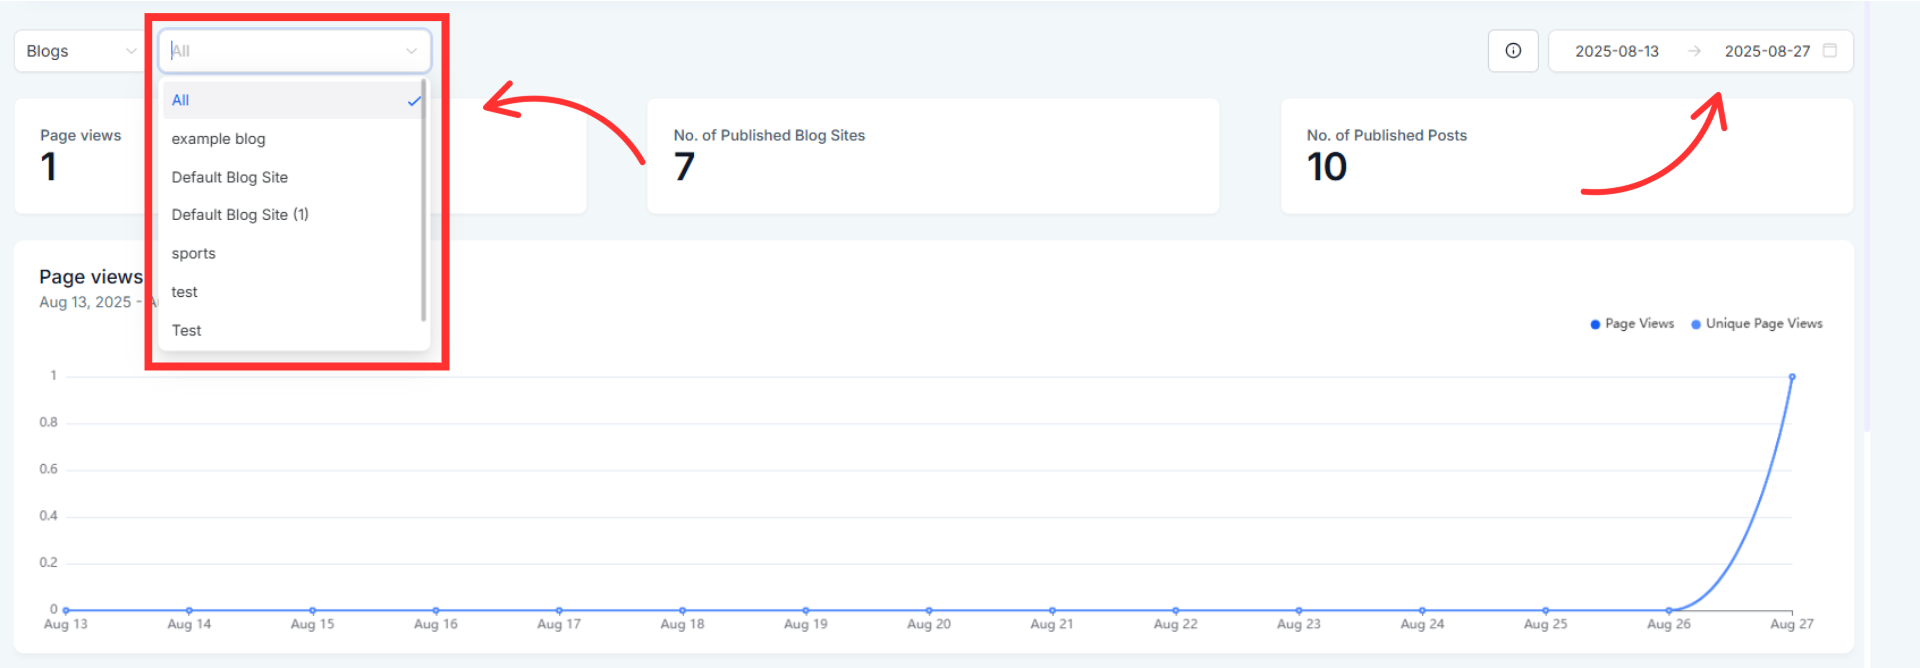
Choose a date range or use a quick preset to load your data.
Scan top metrics and the trend chart to understand overall performance.
Open a post from the list to review its individual stats.
Can I filter by date
Yes. Use the date picker or quick presets to focus your analysis.
Can I see performance by individual post
Yes. Open any post in the list to view its details.
Can I export results
Yes. Use Export CSV to download the data for reporting.
Does this include non-blog pages
No. Statistics here focus on blog posts. Use other analytics for sites or funnels.
How fresh is the data
Data updates periodically. If you just published, allow a short time before checking results.