Topline OS adds geographic analytics with drilldown. Start at a map or region table, click into a state, and drill further into cities to compare performance, spot pockets of demand, and reallocate budget with confidence.
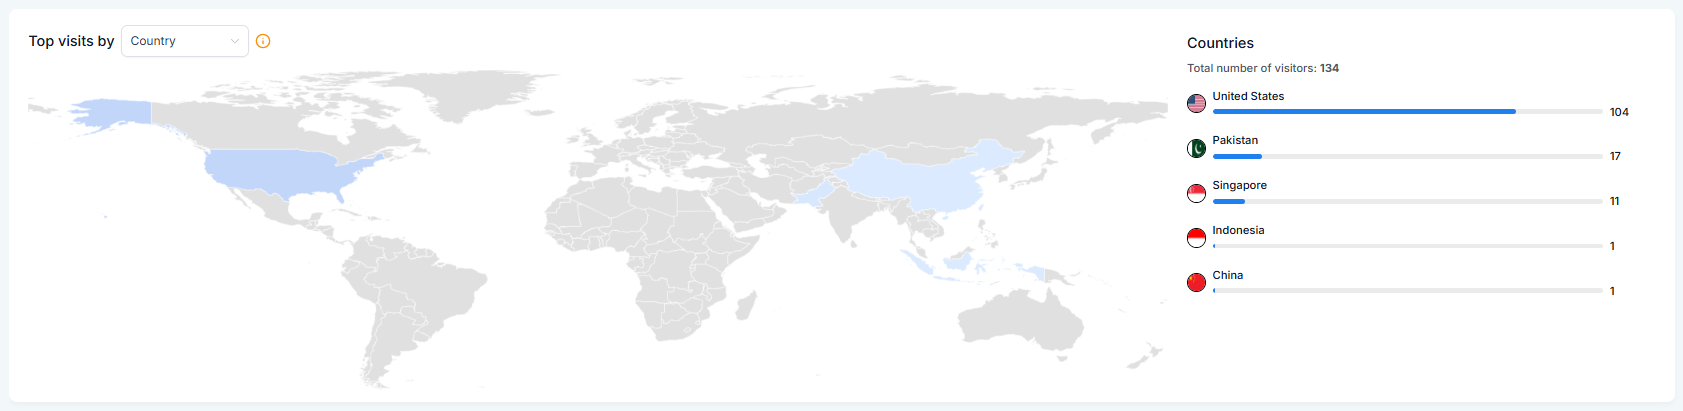
Map and table views that summarize key metrics by region
Drilldown from country to state, then city for detailed comparisons
Filters for date range, channel, campaign, and tags where available
Consistent metrics such as leads, opportunities, revenue, costs, and conversion rates
Export options for sharing and deeper analysis
Compare cities within your top states to find where to double down or pull back
Pair spend and outcome metrics to judge efficiency, not just volume
Save views you check weekly so filters load instantly
Use tags for campaigns or offers to analyze geography by theme
Step 1
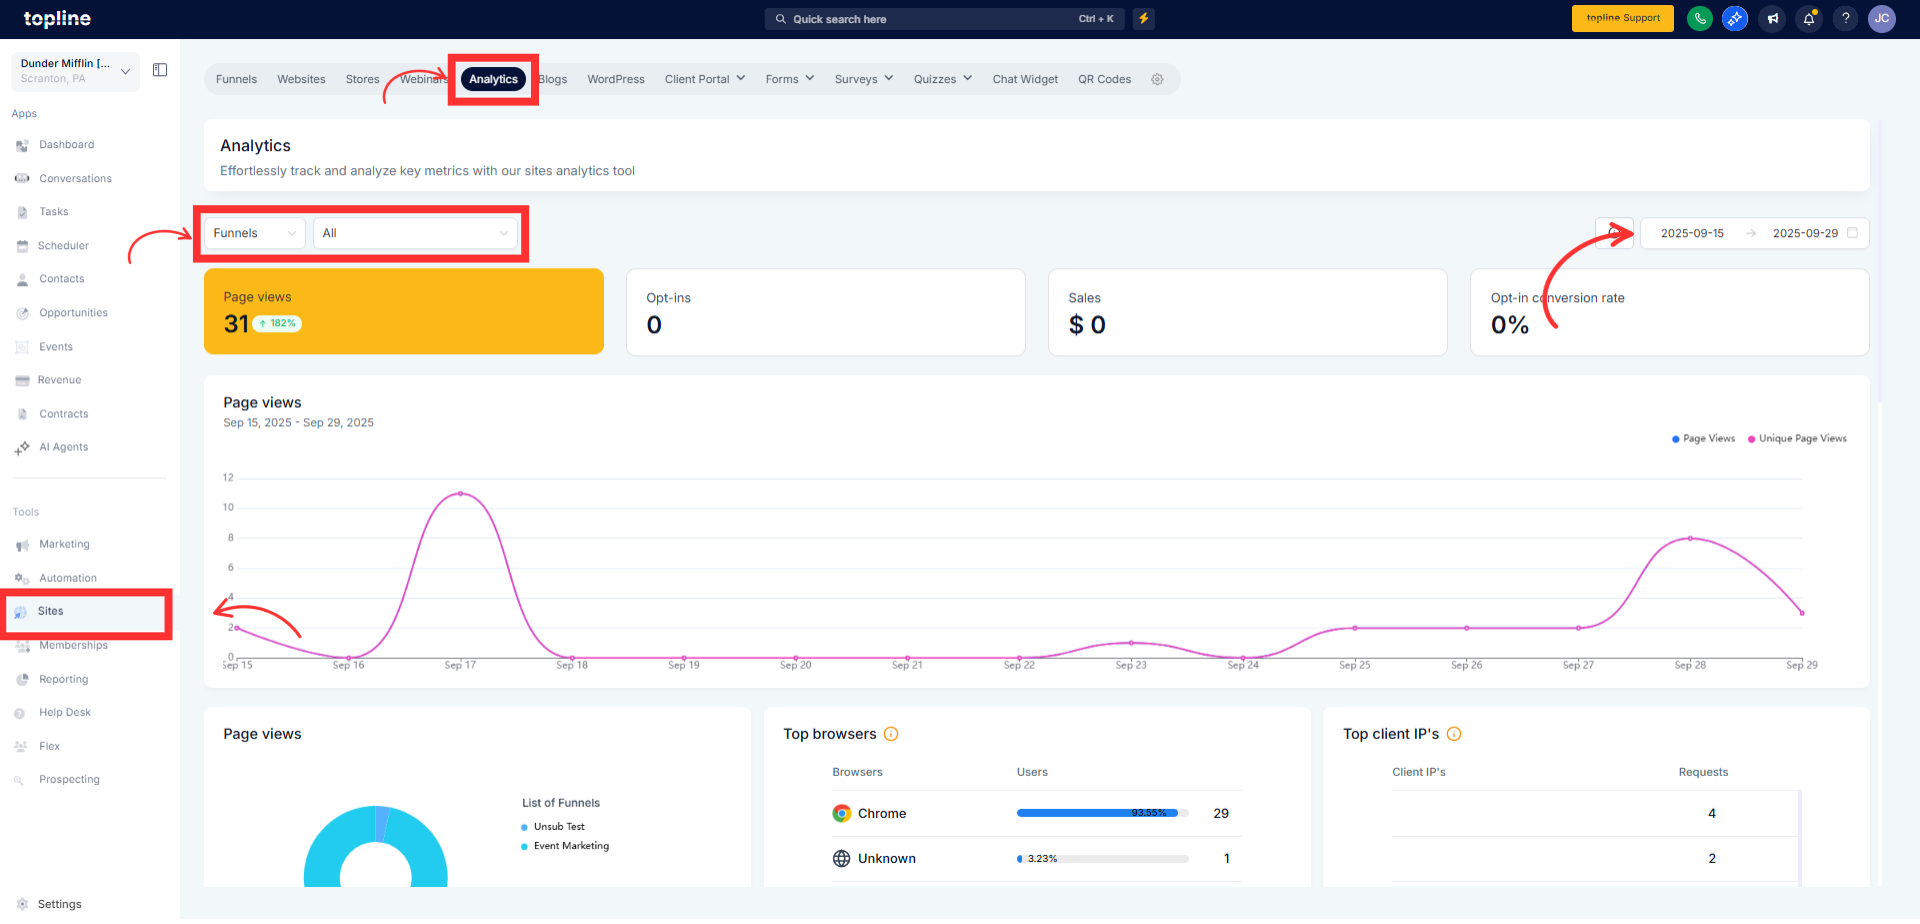
Open Sites > Analytics and scroll down to the Geography or Locations section. Choose a date range and apply filters such as channel, campaign, or tags.
Step 2
Start with the map or region table to see top and underperforming areas. Click a state to drill into city-level metrics and compare cities side by side.
Which metrics are available
Common metrics include leads, opportunities, revenue, costs, and conversion rates. Availability varies by account setup.
Can I filter by campaign or channel
Yes. Use filters to isolate performance by campaign, source, or tags.
How deep can I drill
From country to state, then city. Some regions support additional locality levels.
Can I export the data
Yes. Use Export to download a CSV or share a report link.
Do saved views keep my filters
Yes. Saved views remember your date range and filters for quick reuse.