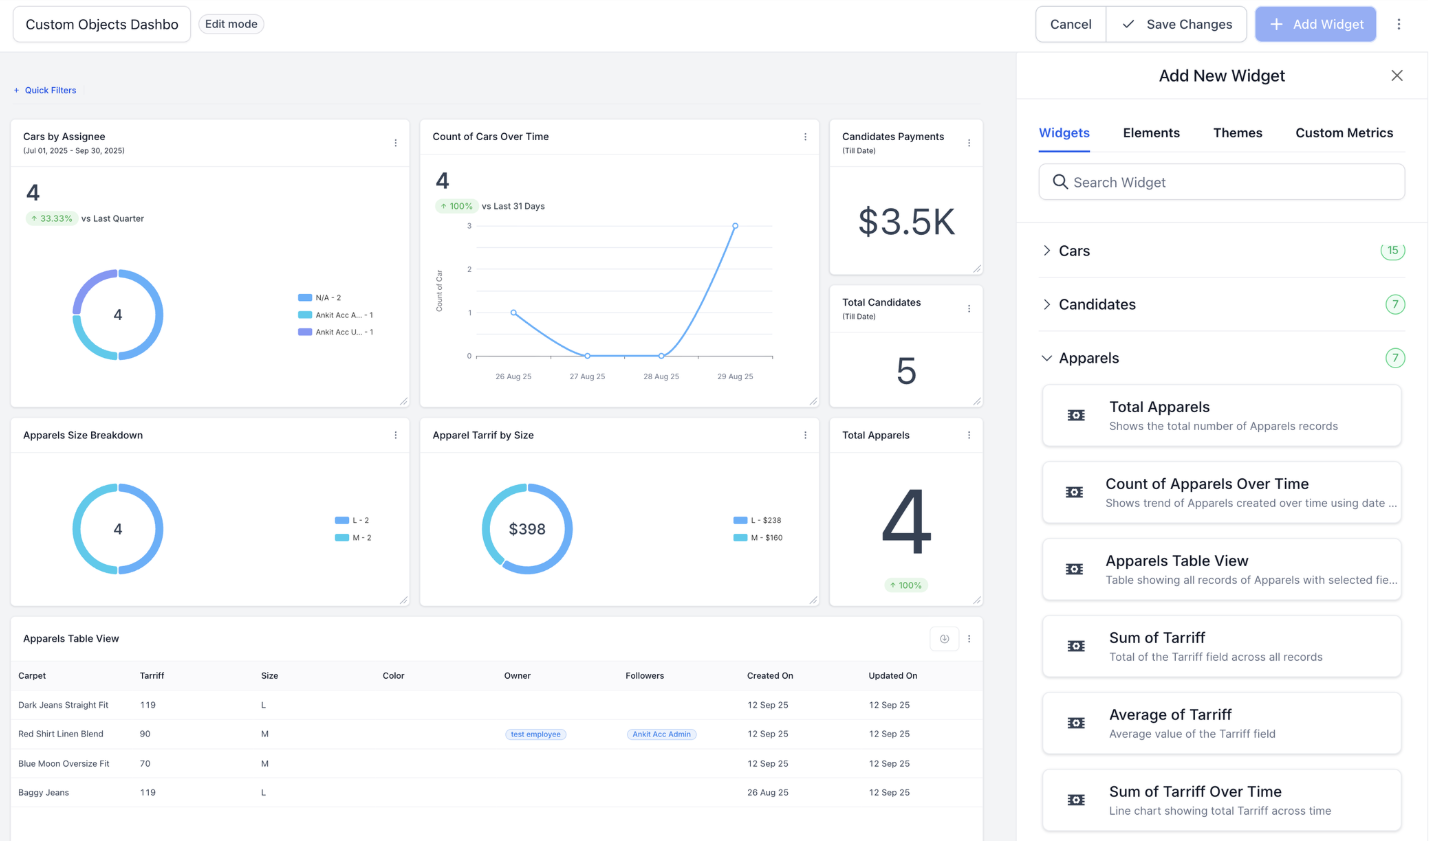
Topline OS expands Dashboards and Reports so sub-accounts can use Custom Objects as data sources. Create KPIs, tables, and visualizations, join related records (e.g., Contacts, Opportunities), filter by fields and date ranges, and add drill-through to detail views. Share widgets with teams while keeping permissions intact.
Custom Objects as data sources in Dashboard widgets and Reports
Widget types: KPI, table, bar/line/area, pie/donut, funnel, summary cards
Field picking, sorting, grouping, and aggregation (count, sum, avg, min, max)
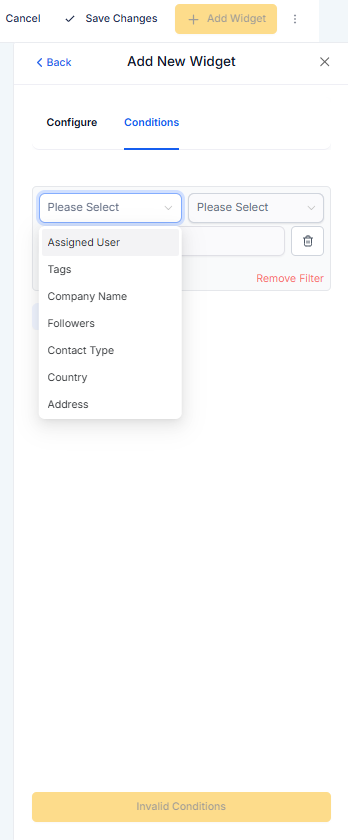
Filters with saved presets; date range controls including rolling windows
Relationships: include related fields from linked objects (e.g., Custom Object → Contact)
Drill-through: click a widget to open a filtered report or the underlying records
Calculated fields: basic formulas and concatenations where supported
Permissions-aware data: honors role access to objects and fields
Performance improvements: caching and scheduled refreshes for heavy widgets
Templates: save and reuse widget/report configs across dashboards
Define a clear primary key/date field on your Custom Object to power time-based charts
Use grouping + aggregation for quick KPIs (e.g., count by status, sum by owner)
Keep table columns lean; add drill-through for details instead of crowding the widget
Create saved filter presets (e.g., “This quarter,” “Owner = Me”) for quicker switching
Name widgets with action-oriented labels like New Requests (7d) or Avg Resolution by Team
Step 1
Open Analytics → Dashboards (or Reports) in your sub-account and click Add widget (or New report).
Step 2
Add filters (fields, tags, date range). Optionally include related fields via relationships (e.g., customObject.contact.first_name).
Which visualizations are supported?
KPI, table, bar, line, area, pie/donut, funnel, and summary cards. Availability may vary by account.
Can I join Custom Objects to Contacts or Opportunities?
Yes, use defined relationships/lookup fields to pull related fields and filter accordingly.
Can I create calculated fields?
Basic formulas (e.g., sum, ratio, concatenation) are supported in reports and some widgets.
Do permissions apply to Custom Object widgets?
Yes. Users only see records/fields they’re allowed to access.
How do date ranges work if my object lacks a date field?
Choose a relevant timestamp (Created/Updated or a custom date). Time-based charts require a date dimension.
Can I schedule report delivery?
Where supported, schedule email exports or snapshots to teams at set intervals.
Will large datasets slow the dashboard?
Caching and scheduled refresh help. Limit columns, use aggregated views, and apply filters for performance.