A new Courses Dashboard delivers speed and clarity powered by a columnar analytics backend. Track enrollments, active learners, lesson completion, time to finish, quiz performance, and revenue. Use saved views, cohort breakdowns, and drilldowns to move from trends to specific learners in a click, all with permission aware access.
High performance analytics backend for rapid loads on large datasets
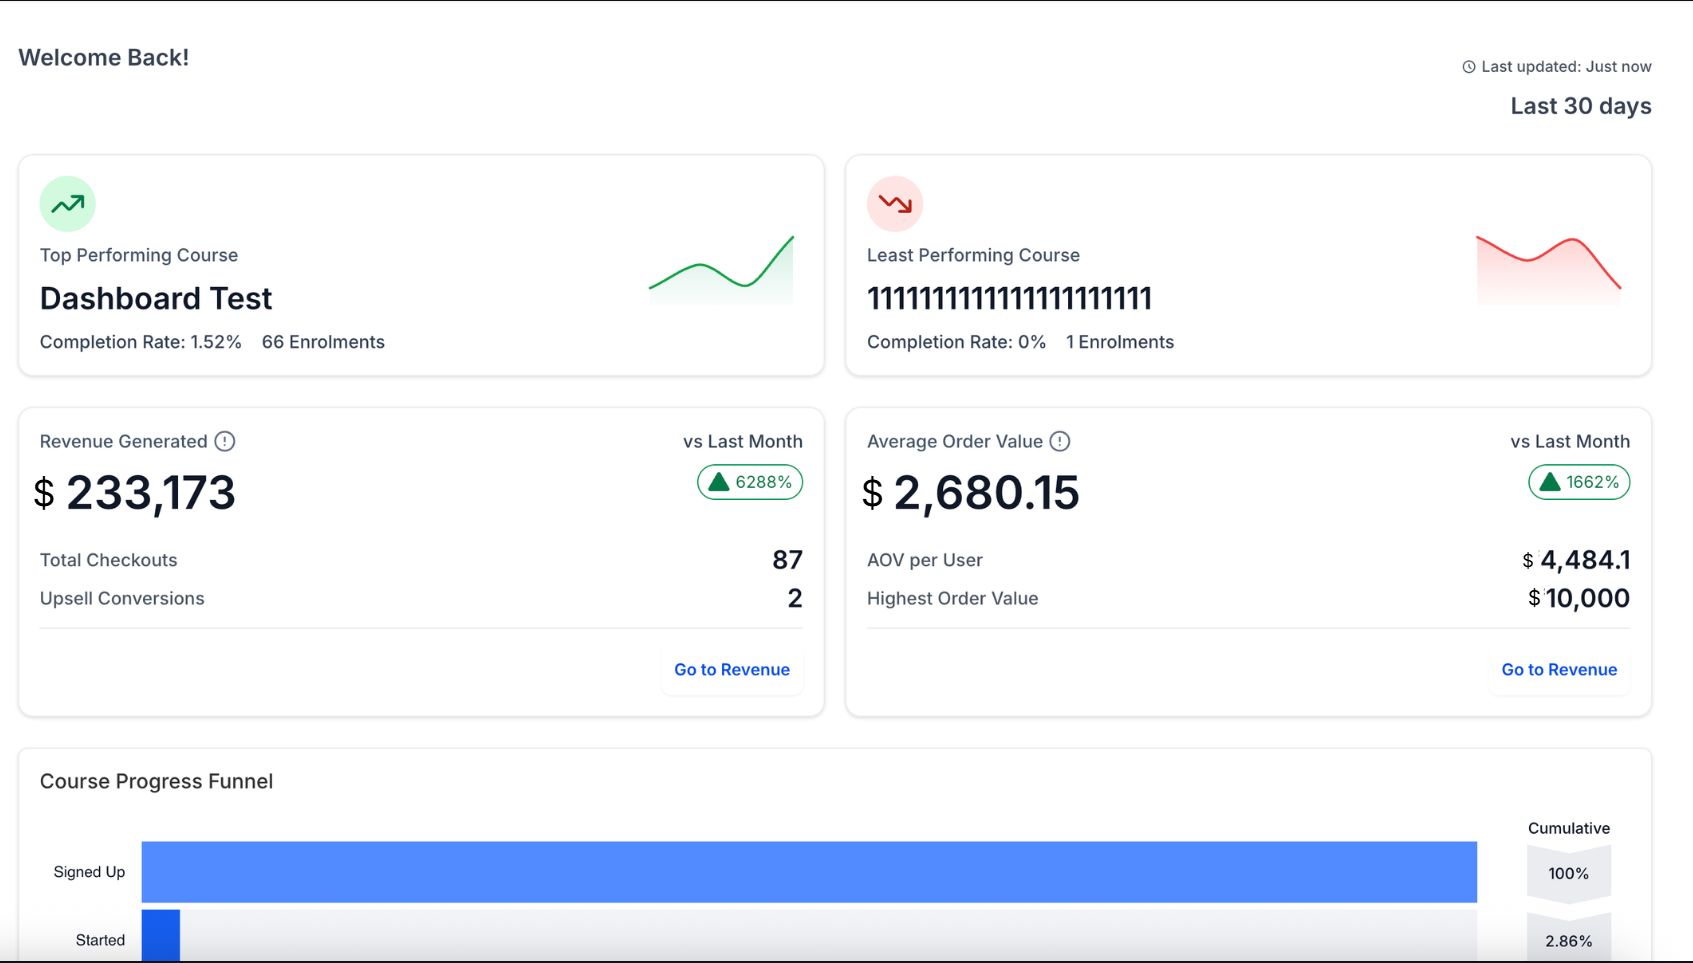
Real time tiles for enrollments, active learners, completions, and revenue
Flexible filters by course, date range, instructor, tag, and plan
Cohort views by signup week or month to visualize progression
Drilldown from KPIs to learner lists, attempts, and lesson activity
Lesson level metrics across watch rate, quiz pass rate, and drop off points
Comparison mode for course vs course and period over period analysis
Saved views with sharable links and role based permissions
Export options for summaries and underlying learner records
Data freshness indicators with last updated timestamps
Start with a 28 day range to catch current behavior without seasonal noise
Save a view per flagship course so the team can monitor the same metrics daily
Compare this month vs last month to validate impact after curriculum changes
Use cohort breakdowns to see if new learners progress faster than older cohorts
Sort lessons by lowest completion to prioritize content fixes
Filter by plan or price to evaluate revenue per learner and refund impact
Export drilldown results to share action lists with instructors or support
Step 1
Navigate to Analytics and select Courses Dashboard.
Step 2
Choose rolling or fixed dates, such as the Last 7 days, the Last 28 days, or a custom window. Filter by course, instructor, tags, plan, or cohort to focus the view.

What metrics are included on the dashboard?
- Enrollments, active learners, completion rate, average time to complete, lesson watch rate, quiz pass rate, refunds, and revenue totals
How fresh is the data I am seeing?
- Tiles show a last updated timestamp and refresh on a frequent schedule with near real-time updates for key events
Can I drill down to individual learners?
- Yes, drill-downs open learner level views with enrollment status, lesson progress, quiz attempts, and timestamps
Do you know if comparisons are supported?
- You can compare periods or courses side by side to measure the effect of content or pricing changes
Can I export results?
- Exports are available for summary metrics and underlying learner lists for further analysis
Do permissions affect what I see?
- Yes, results are permission-aware aware so users only see courses and learner data they are allowed to access