The Date Range filter is based on the Date Created of the leads.
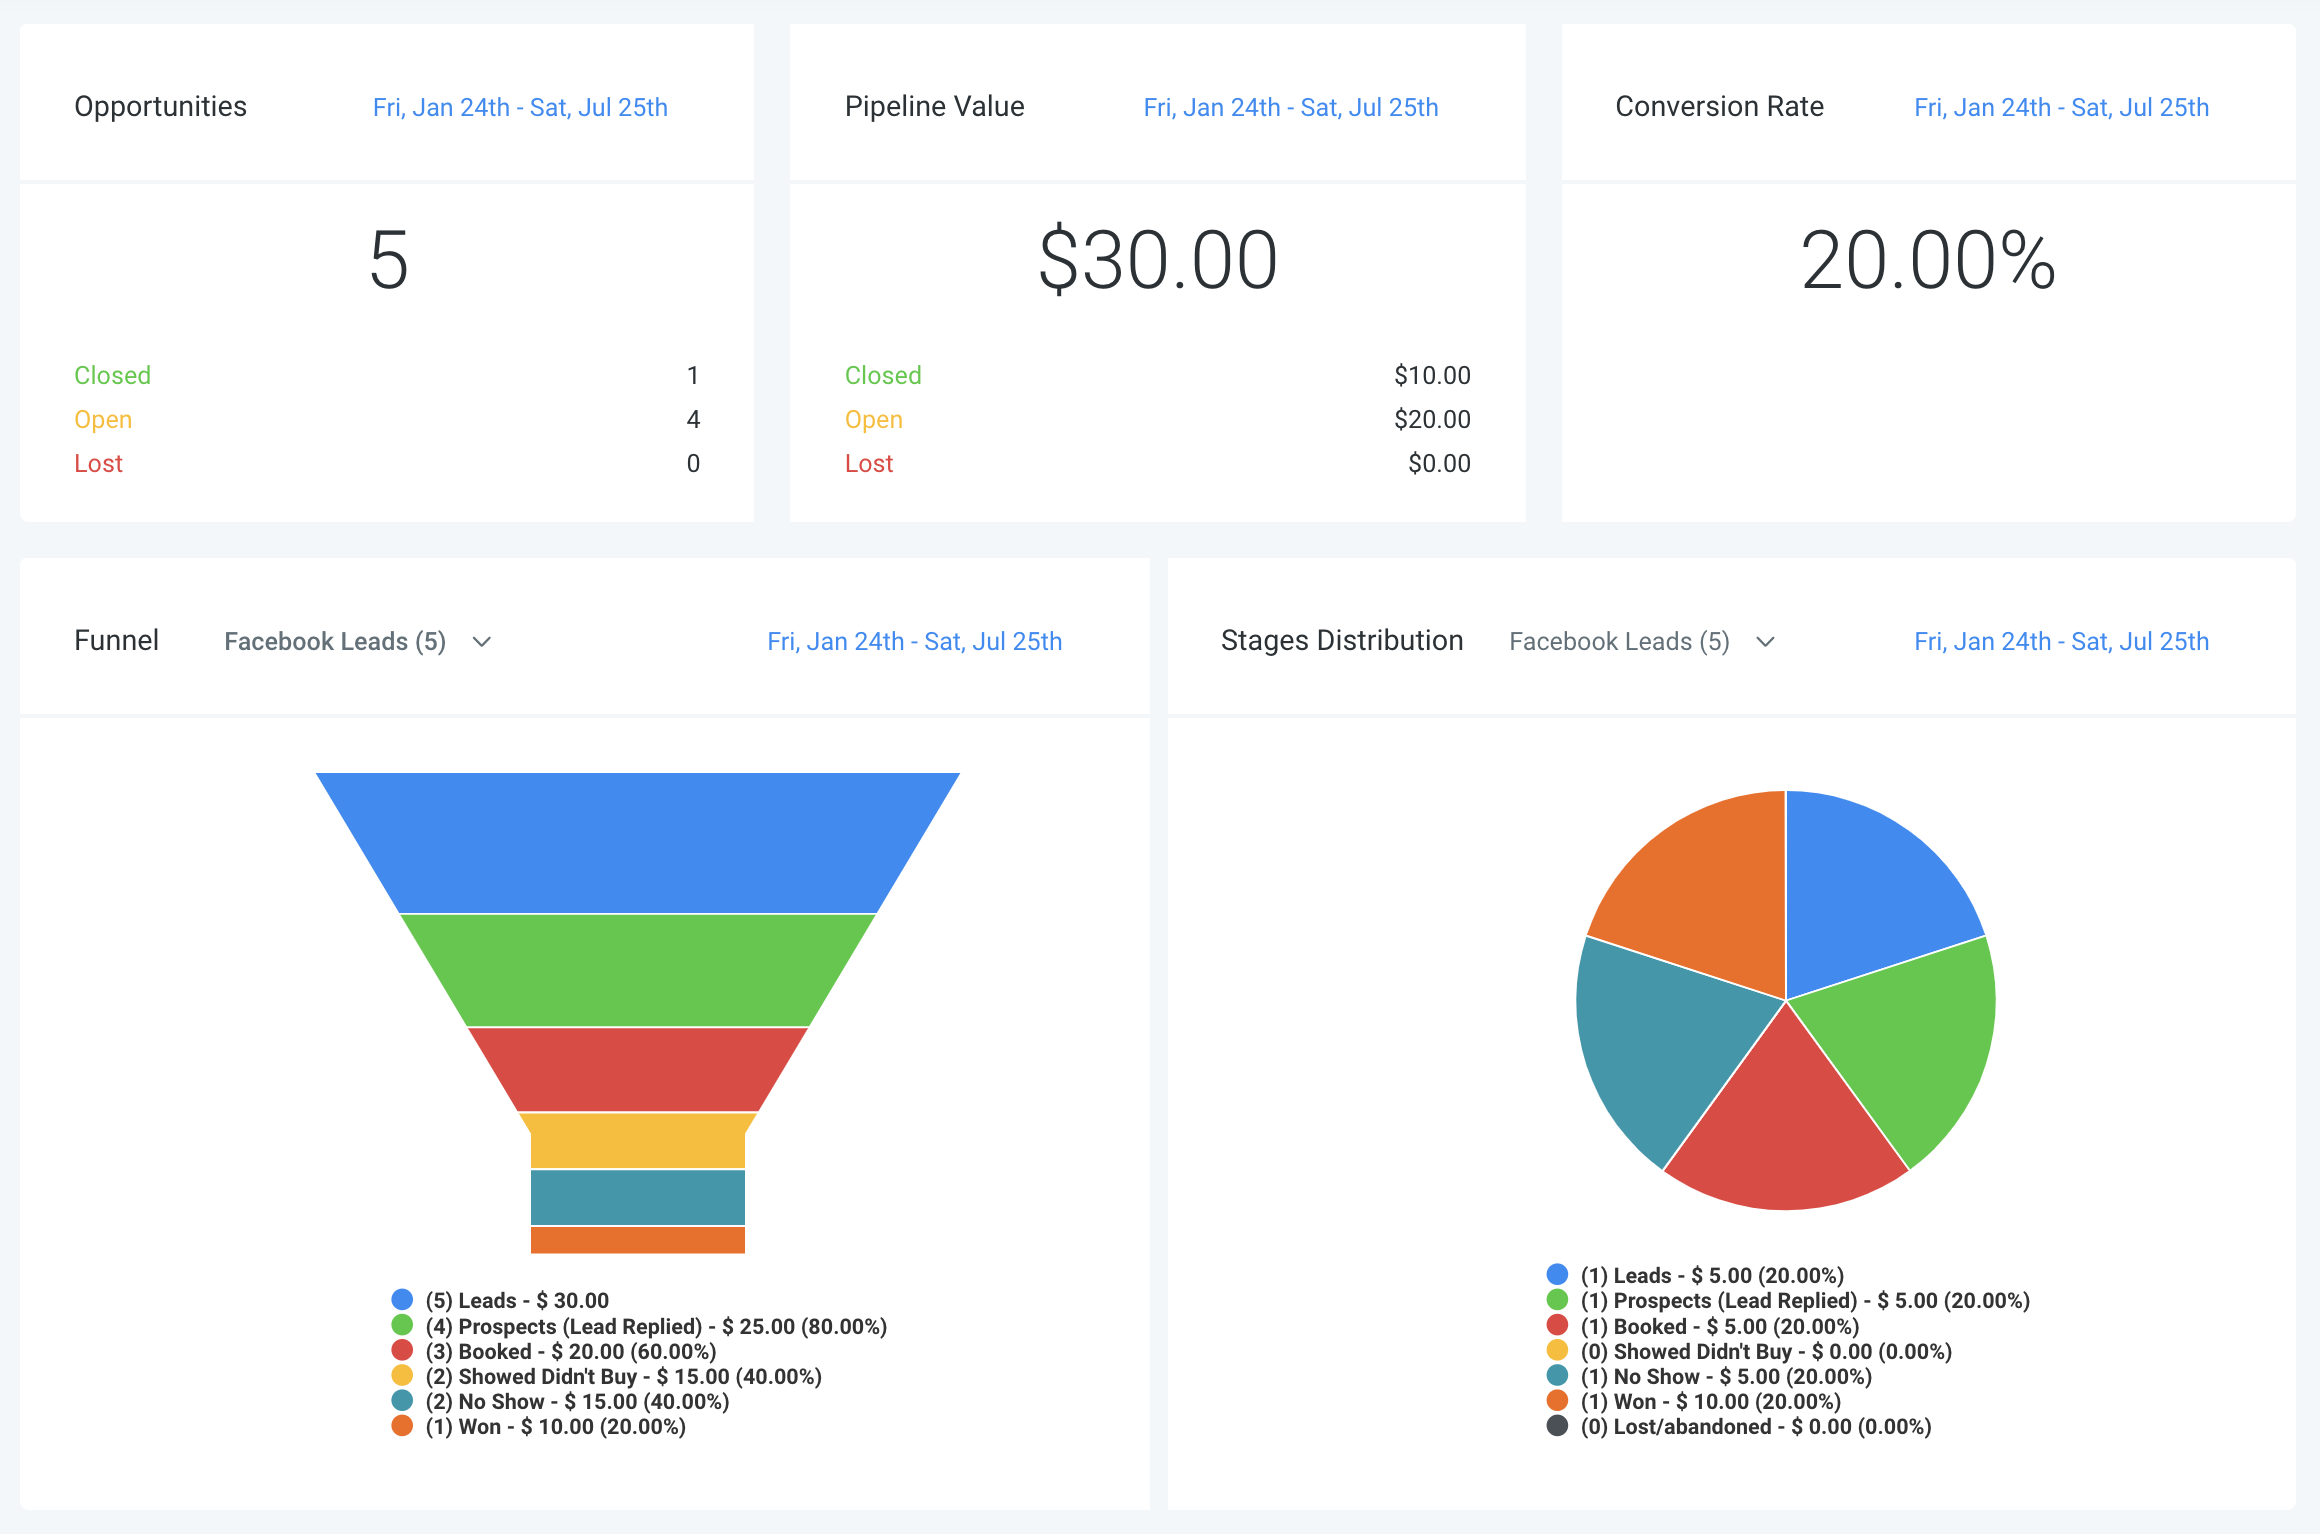
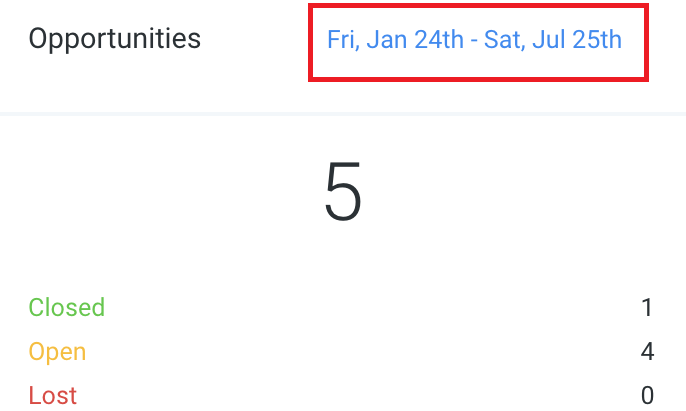
So the opportunities view above shows the 4 leads who opt-in to HL from Jan 24th to Jul 25th are in OPEN status.
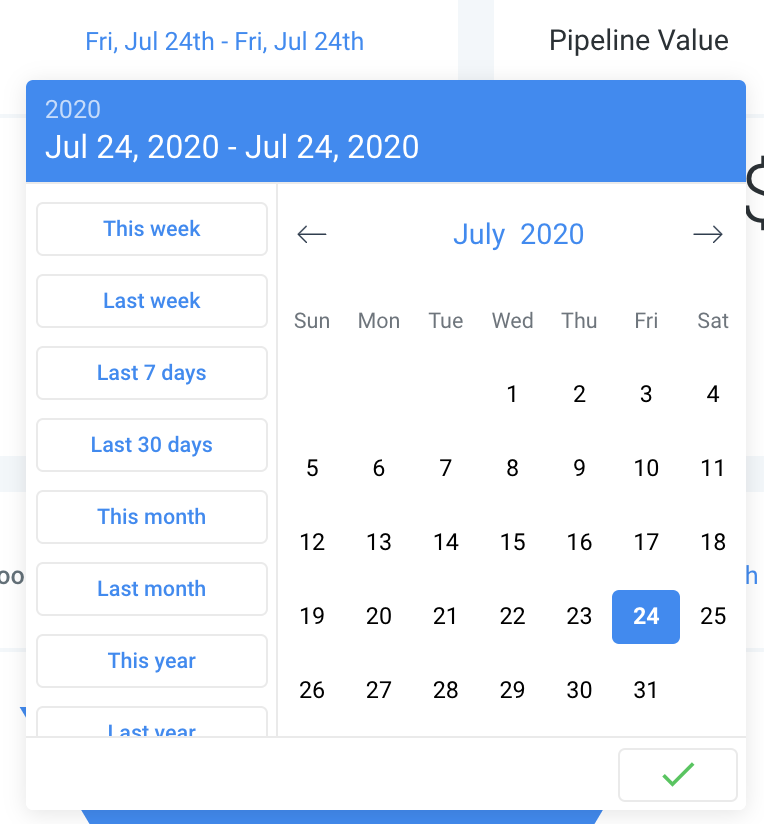
You can double-click a date to see the number of leads who opted in on that date.
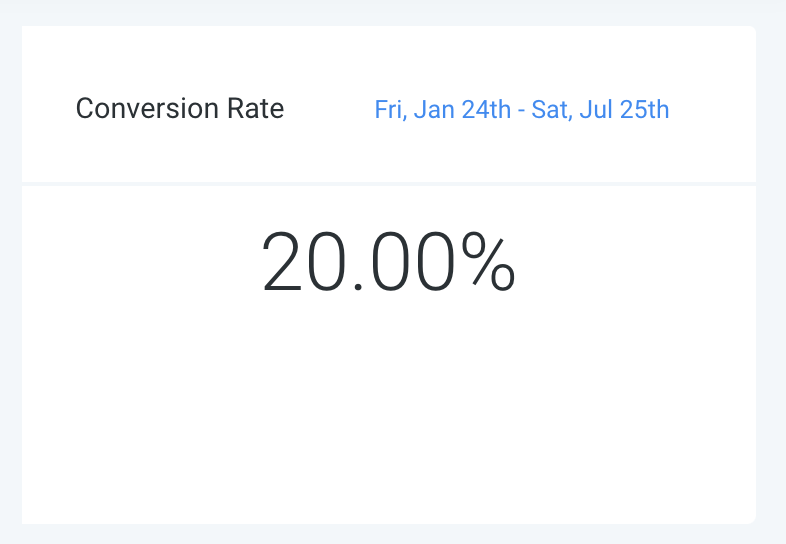
Conversion rate = the number of leads in the WON status (1) divided by all the leads opt-in (5)
WONs are automatically added at the end of the list. As a result, there is no need for you to create a WON stage to track leads in the WON status.
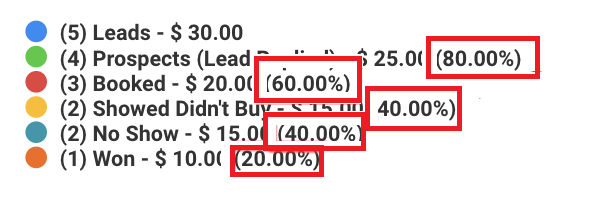
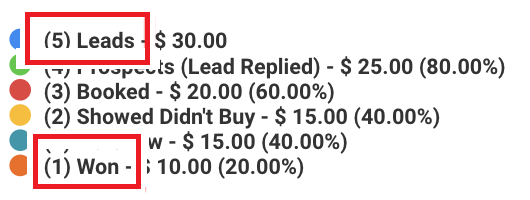
The percentage on the right for the Prospects stage means that 80% of the leads who joined the Facebook Leads pipeline will move forward to the Prospects stage.
60% of the leads who joined the Facebook Leads pipeline will move forward to the Booked stage.
The way we build our pipeline is like a sales stage. E.g. If we have a pipeline for stages like Elementary school, High school, University. If the person is in the University stage, we will increase the number of leads in the stage for Elementary and High school by 1 because we assume that the person has been to those stages.
For instance, if you want to track the leads who are in the NO SHOW stage, you shouldn't use the Funnel chart because that will mean that 40% of leads who joined the Facebook Leads pipeline will move forward to the NO SHOW stage. Only one lead is no show, so it should be 20% instead of 40%. The other lead is marked WON. Leads who have been marked as WON will have the number of leads on all stages increased by 1 since we assume they completed all the steps to buy the product.
If you want to refer to the Funnel chart, each pipeline stage should be one step closer to sale, like Prospect > Survey submitted > Consultation > Purchase
If you want to keep track of stage like No-shows, showed didn't buy, you could refer to the Stages Distribution chart.
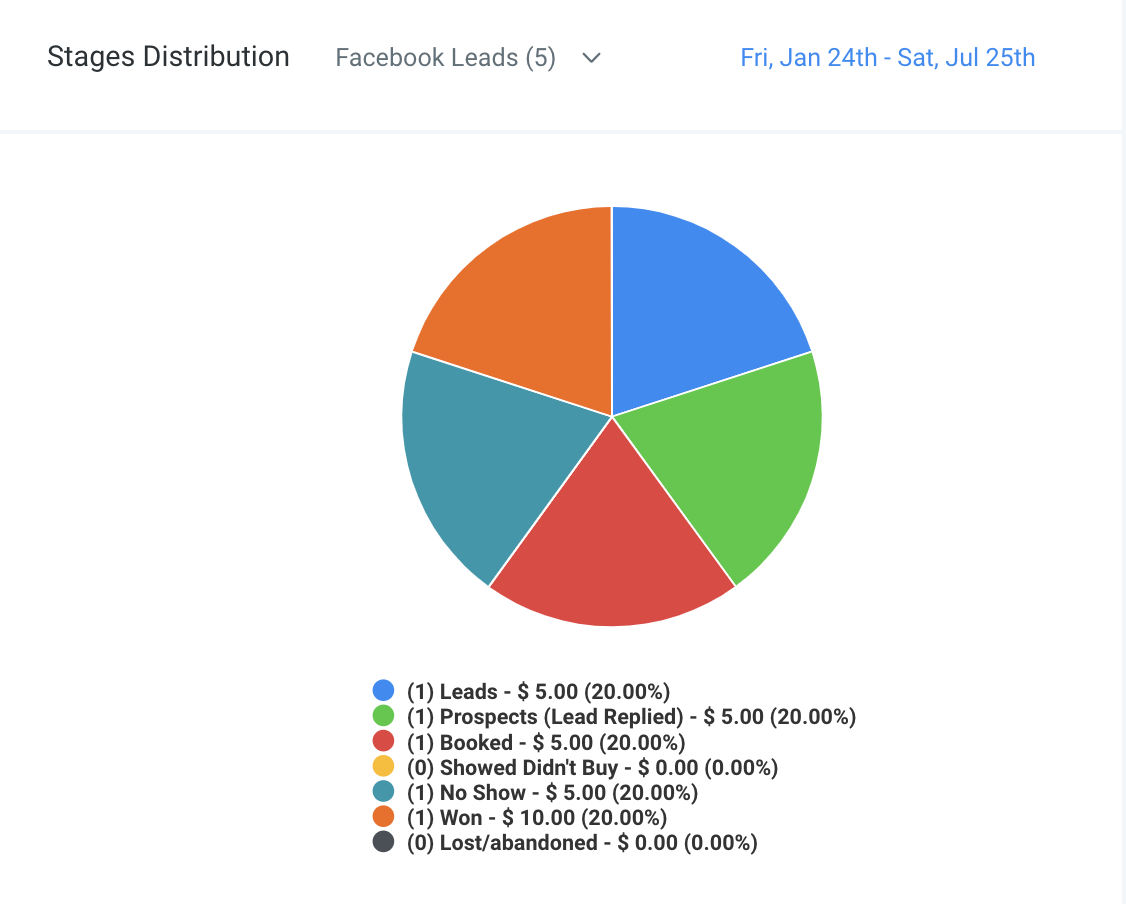
The chart above simply shows the number of leads who are currently in which stages.
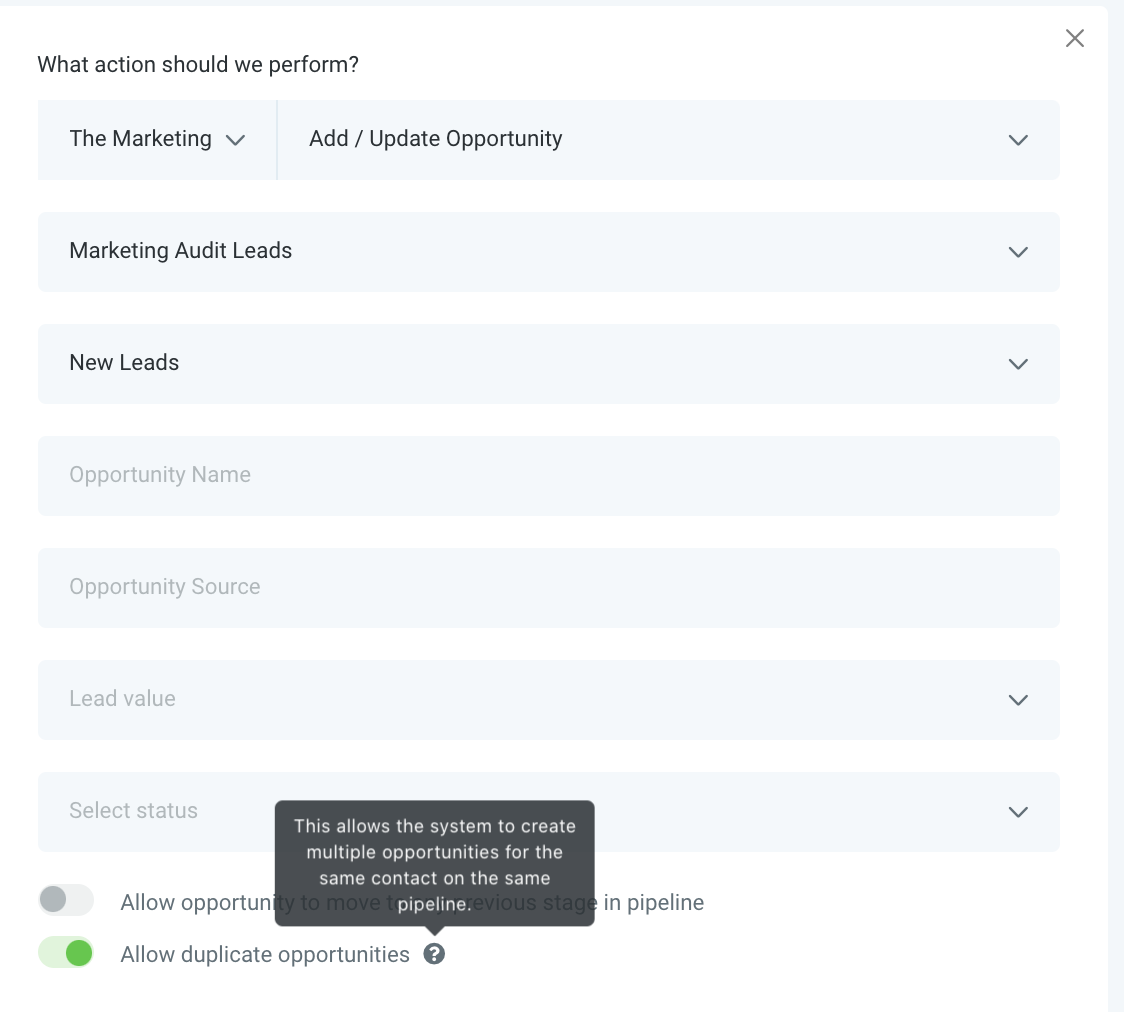
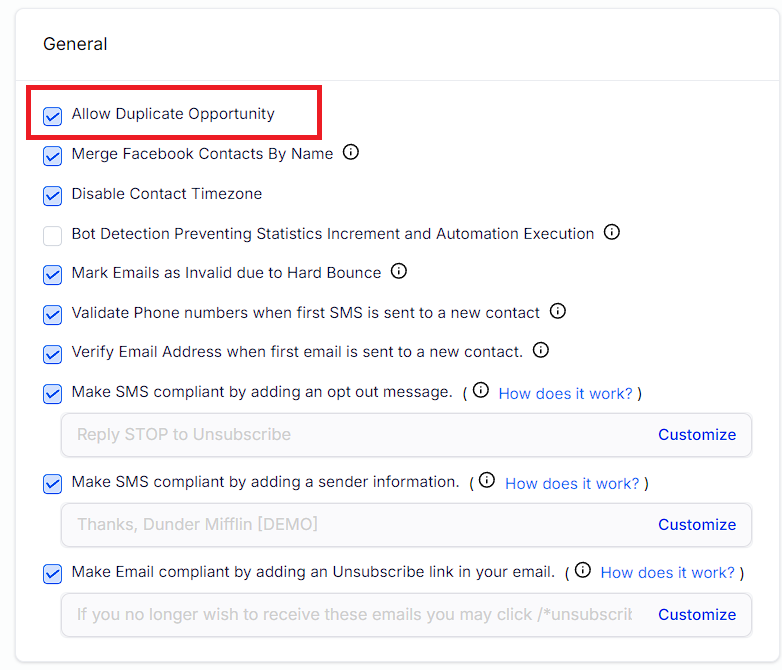
Alternatively, you may want to Allow Duplicate Opportunities to keep track of how many people have been to the No Show stage.
Make sure that the trigger action "Add/Update Opportunity" also has "Allow duplicate opportunities" toggle on.